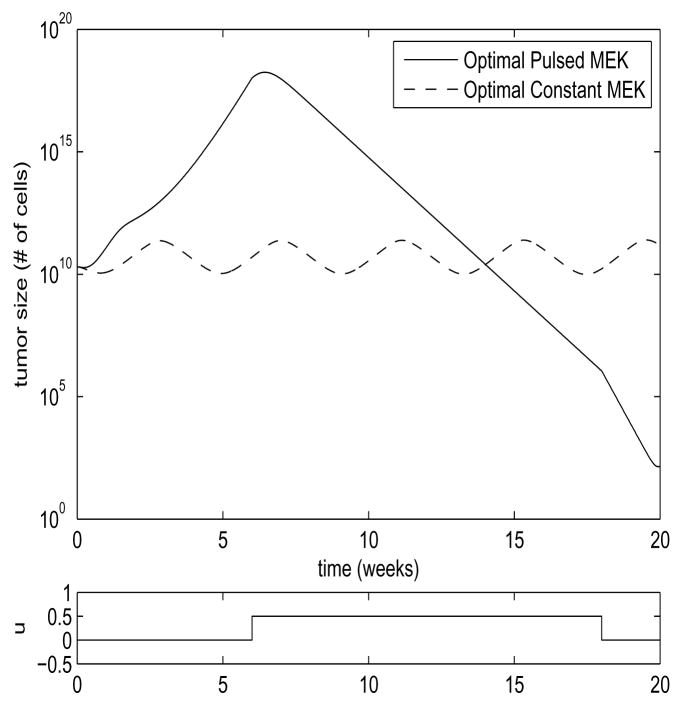
Fig. 5. Stable Steady State Comparison.
Parameter values are ρ = 5, β = 20, d = 0.01, a = 5, k = 0.5, b = 5, η = 1.2, h = 0.5, γ = 2, ε = 1.95. Shown are the plots of the sum x+y for the two strategies. Values are scaled by 1010 to correspond to number of cells. Optimal constant u = 0.5. MEK inhibitor application for the pulsed treatment is shown in the lower plot.

