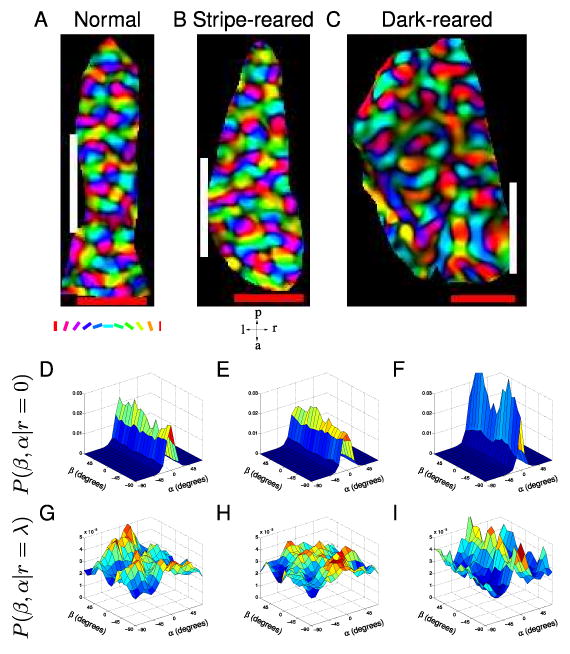
Figure 2. Illustrations of reduced symmetry in normal, stripe-reared and dark-reared cats.

Representative examples of cat orientation preference maps and joint probability distributions P(β, α|r) at r/λ = {0,1} for the three rearing conditions. Orientation maps are polar; the colour encodes the orientation preference according to the key under A and the brightness encodes the orientation selectivity strength. Our estimate of the position of each map's vertical meridian, which was used to orientate the maps retinotopically, is marked with a white line. The red scale bars are 1 mm. These maps have been flipped vertically after rotation to give them a right-handed coordinate system and then masked to eliminate points outside V1. Only the unmasked points were used in all subsequent analysis. (A,D,G) Representative example from a normal cat. A Orientation preference map. D P(β, α|r = 0). At short distances there is little β-dependence in the probability distribution, with almost all the probability near α = 0 indicating that the orientation preferences of pixels close to another tend to be similar. G P(β, α|r = λ) demonstrates a β-dependence in the probability distribution, indicating that reduced symmetry exists at separations of approximately λ. (B,E,H) Representative example from a stripe-reared cat. This cat was reared in environment rich in 135° lines. B Orientation preference map. E P(β, α|r = 0). H Ridges in P(β, α|r = λ) indicate the presence of co-circularity with offset. While the proportions of the map preferring each orientation changes under stripe-rearing conditions, the joint probability distributions P(β, α|r) did not demonstrate qualitatively different properties to normally reared cats. (C,F,I) Representative example from a dark-reared cat. C Orientation preference map. F P(β, α|r = 0). I P(β,α|r = λ). Despite the maps of dark-reared cats showing visually obvious differences, such as less clearly defined pinwheels and a “blobbier” structure than those from normally reared cats, they also demonstrated reduced symmetry at separations of approximately λ.
