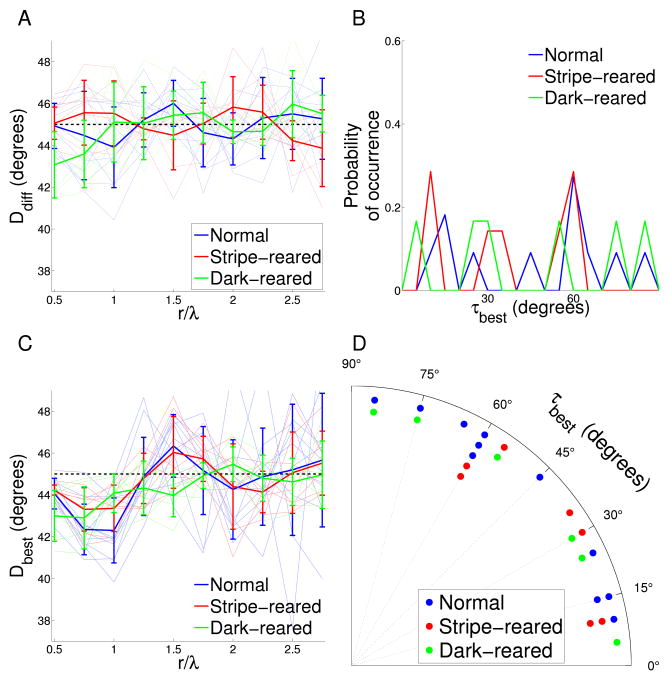
Figure 3. Analysis of reduced symmetry in experimental maps.
A Co-circularity strength Ddiff(r) calculated for varying pair separations for the cat orientation preference maps under different rearing conditions. Thin lines are the results from individual cats; thick lines are the means for the different rearing conditions. The dashed black line at 45° shows the expected mean value when no co-circularity is present. There is no significant difference in the mean Ddiff(r) for any r between any rearing condition and their randomly permuted controls except at r = 1.5λ (p = 0.01) for normal maps, r = 2.5λ (p = 0.05) for stripe-reared and r = 0.5, 2.5 (p = 0.01, 0.01) dark-reared. This indicates that no rearing condition shows significant co-circularity at r = λ, where it would be expected if the reduced symmetry in the maps was driven by co-circularity in natural scene input. Between normal and stripe-rearing, the only positions displaying significant difference in Ddiff is r = 1.5, 2.0λ (p = 0.03). There are significant differences between normal and dark-reared cats at r = 0.5 (p = 0.01) and stripe-reared and dark-reared cats r = 2.5 (p = 0.01). B Density plot showing the distribution of τbest, the angle of rotation of each orientation map required to bring it into maximal agreement with co-circularity for r = λ. There is no significant grouping of τbest, either by rearing condition or cumulatively (p > 0.6). This indicates that the reduced symmetry in the maps is unlikely to have arisen due to natural scene input, since this would have defined a consistent coupling between retinotopic and cortical axes. Because τ is circularly symmetric at 90°, the ends of the x-axis can be thought of as joined and τ values near 90° are also close to 0. C Maximum co-circularity strength Dbest(r) after rotation by τbest for all rearing conditions. The dashed black line at 45° shows the expected mean value when no co-circularity is present. There are significant differences between normal results and control (randomly shuffled) maps at r = 0.5, 0.75, 1,1.5λ (p < 0.01), between stripe-reared and control maps at r = 0.5, 0.75, 1, 2.25λ (p < 0.03), and between dark-reared and control maps at r = 0.5, 0.75, 1, 1.5λ (p < 0.01). This indicates that all rearing conditions demonstrate statistically significant reduced symmetry near 1λ, but not co-circularity (as demonstrated in B). There is no significant difference in the mean Dbest(r) between normal and stripe-reared cats for any r. There are significant differences in the mean Dbest(r) between normal and dark-reared cats at r = 0.5, 1, 1.5λ (p < 0.04), and between stripe- and dark-reared cats at r = 0.5, 1.5λ (p = 0.01, 0.02 respectively). The differences may be due to difficulties in defining a value for λ in the dark-reared maps. Note that the minimum value for Dbest is similar for the dark-reared cats compared to the other rearing conditions, indicating that the overall strength of reduced symmetry in the maps is not changed by rearing condition. D The same data (τbest) as in (B) but presented as a polar histogram. All statistical tests as described in Methods section.

