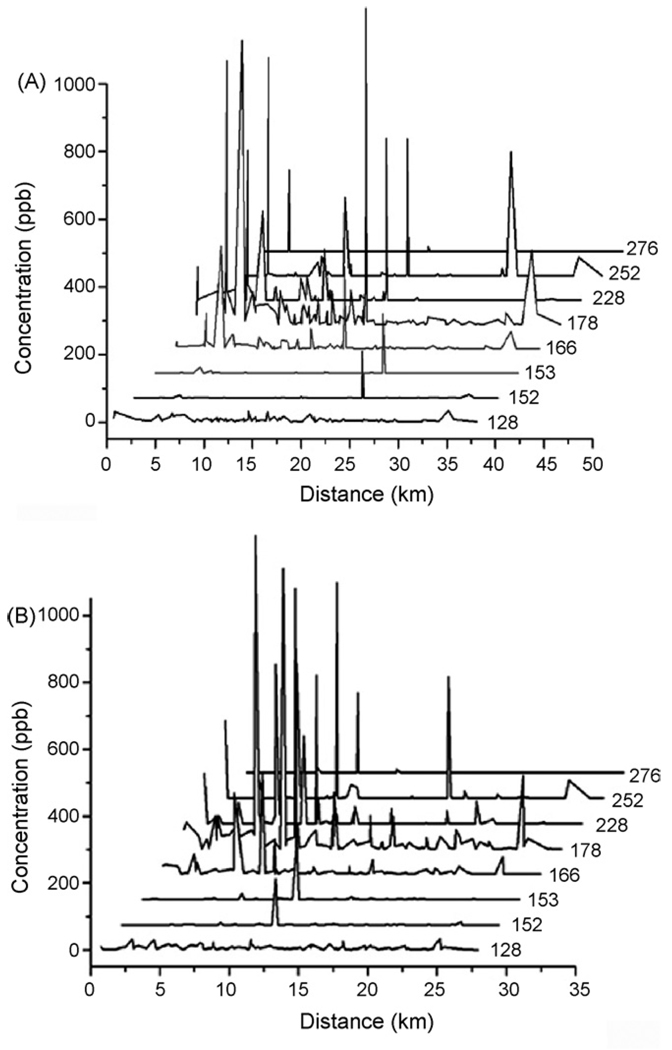
Fig. 7.
PAHs distribution profiles based on molecular weight and the distance between the sampling sites and the closest industrial area. (A) The distance was measured between the sampling sites and the industrial area at westside/downtown El Paso; (B) the distance was measured between the sampling sites and the industrial area in the east side of El Paso. PAHs were grouped based on their molecular weights.

