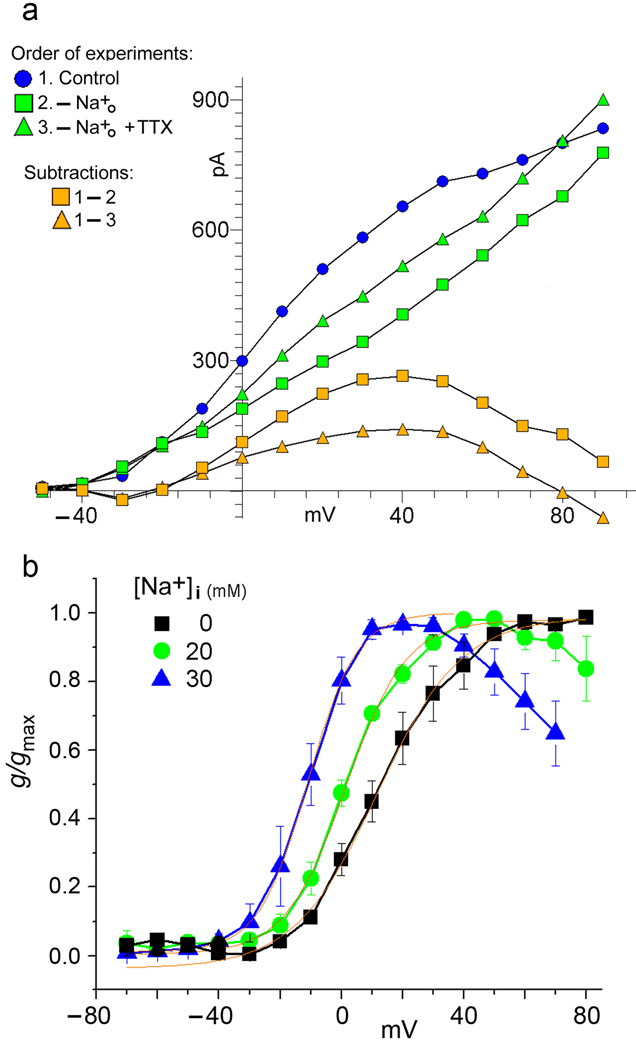
Figure 5. Experiments in cells loaded with high [Na+]i.
5a: inhibition of delayed outward current by sodium efflux from an MSN. Effects of reversing the direction of TTX-sensitive sodium flux across the membrane. The intracellular pipette solution contains 40 mM Na+. 1. Control: Delayed outward currents plotted from the cell with normal [Na+]o. A series of control voltage-clamp step pulses were applied at 10 mV intervals to a maximum of +90 mV. 2. -[Na+]o: Outward currents plotted from the same cell after the removal of external Na+. This plot shows the delayed outward current in response to the same series of voltage-clamp step pulses after reversing the direction of Na+ current flow, which is now outward along the entire voltage range. 3. -[Na+]o + TTX: Outward currents plotted from the same cell after subsequently adding TTX to the 0[Na+]o condition in 2. above. This plot shows the delayed outward current in response to the same series of voltage-clamp step pulses after reducing the outward movement of Na+. Experiments shown in this figure were repeated seven times in MSNs and three times in tufted/mitral cells with similar results.
5b: Conductance/voltage relations showing the normalized incremental conductance increases in the delayed outward current due to Na+ influx in cells loaded with different levels of [Na+]i. Tufted/mitral cells “loaded” with different intracellular concentrations of Na+, as indicated, were subjected to a series of voltage clamp step pulses. The incremental conductance/voltage curves plotted were constructed from the residual currents obtained by subtracting the currents recorded after removal of external Na+, from the control currents recorded in normal [Na+]o (as in Figure 5a, subtraction 1–2). As [Na+]i increases, the incremental conductance curves shift leftward to more negative voltages, and also show a steeper slope. This seems consistent with the hypothesis that, at higher concentrations of bulk [Na+]i, the sodium influx is augmenting the local Na+ concentration to yet a higher level. Conductances were calculated for individual cells at the three indicated concentrations, normalized to the maximum value, and then averaged. Regions of the curves to the left of Gmax were fit by a Boltzmann equation, shown in red. 0 mM [Na]int (■) V½ = 11.8 mV, n = 3; 20 mM [Na]int ( ) V½ = 1.40 mV, ENa = 50.8 mV, n = 3. 30 mM [Na]int (
 ) V½ =
  11.0 mV, ENa = 40.5 mV, n = 4.

