Figure 4.
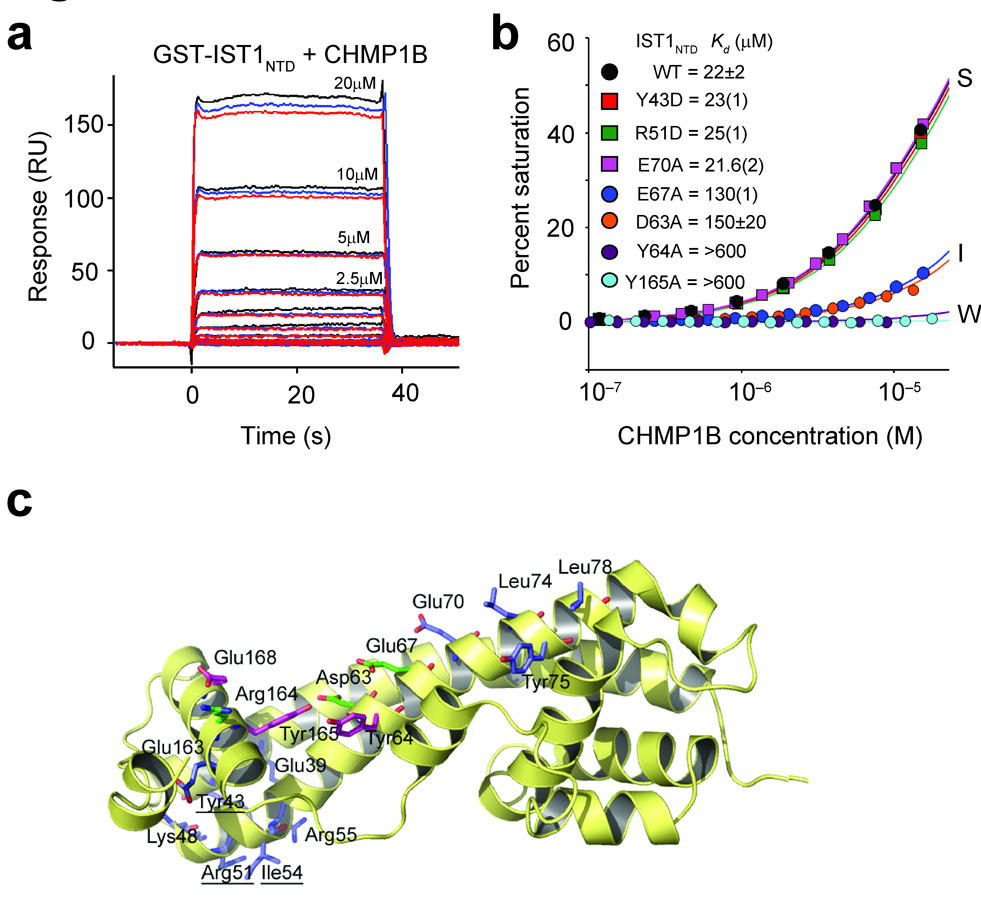
Mutational analyses of IST1-CHMP1B interactions. (a) Sensorgrams showing different concentrations of purified CHMP1B binding to immobilized GST-IST1NTD. Triplicate measurements in response units (RU) are shown for each CHMP1B concentration. (b) Representative biosensor binding isotherms showing CHMP1B binding to wild type (WT) and mutant GST-IST1NTD proteins with strong (S), intermediate (I) and weak (W) binding affinities. IST1NTD mutations and estimated dissociation constants are given in the inset. Errors represent either standard deviations from multiple independent measurements (n≥3), or standard deviations derived from single isotherms measured in triplicate (values in parentheses report the standard deviations in the final digit of the measurement).(c) Ribbon diagram showing the location of all IST1NTD mutations tested for CHMP1 binding. Mutated residues are shown explicitly, and the binding affinities of the mutant proteins are color-coded as follows: blue, strong (S) binding (binding affinities within 1.5-fold of wild type IST1NTD); green, intermediate (I) binding (binding affinity reduced 1.5–8 fold); magenta, weak (W) binding (binding affinity reduced ≥8-fold).

