Figure 7.
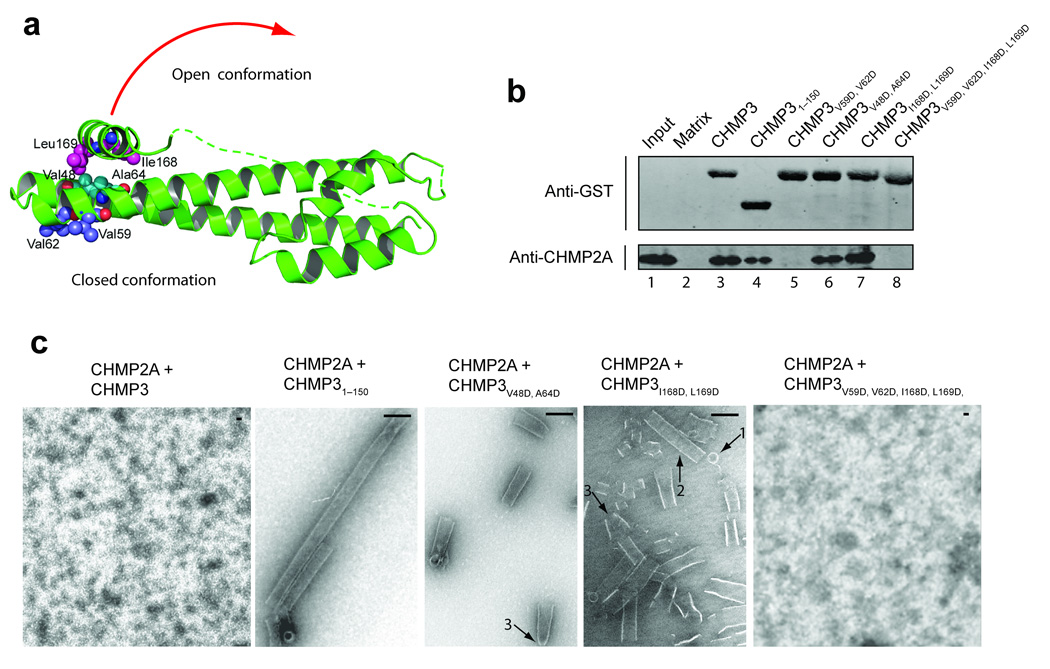
CHMP3 activation in vitro. (a) Ribbon diagram showing the locations of mutated CHMP3 residues at the tip of the α1/α2 hairpin (purple) and activating mutations on either side of the interface between the core α2 helix (cyan) and the autoinhibitory α5 helix (magenta). The red arrow suggests how the closed CHMP3 conformation might convert into an open conformation by dissociation of the autoinhibitory α5 helix from the core. (b) GST pull-down analyses of the binary CHMP3/CHMP2A interaction. Pure recombinant CHMP2A (lower panel, anti-CHMP2A) was tested for binding to a glutathione sepharose matrix (lane 2, negative control) or to immobilized wild type (lane 3) or mutant GST-CHMP3 proteins (lanes 4–8). Both proteins were detected by Western blotting, and input CHMP2A (0.3%) is shown in lane 1 for reference. (c) EM analyses of helical CHMP3-CHMP2A assembly. Different panels show assemblies formed by 1:1 mixtures CHMP2A with: full length, wild type CHMP3 (panel 1, negative control, no assembly), CHMP31–150 core domain (panel 2, positive control), activated CHMP3V48D,A64D (panel 3), activated CHMP3I168D,L169D (panel 4), and activated and tip mutant CHMP3I168D,L169D,V59D,V62D (panel 5, no assemblies). Arrows highlight rings (1), tubes (2), and cones/tapered tubes (3). Scale bars are 100 nm.

