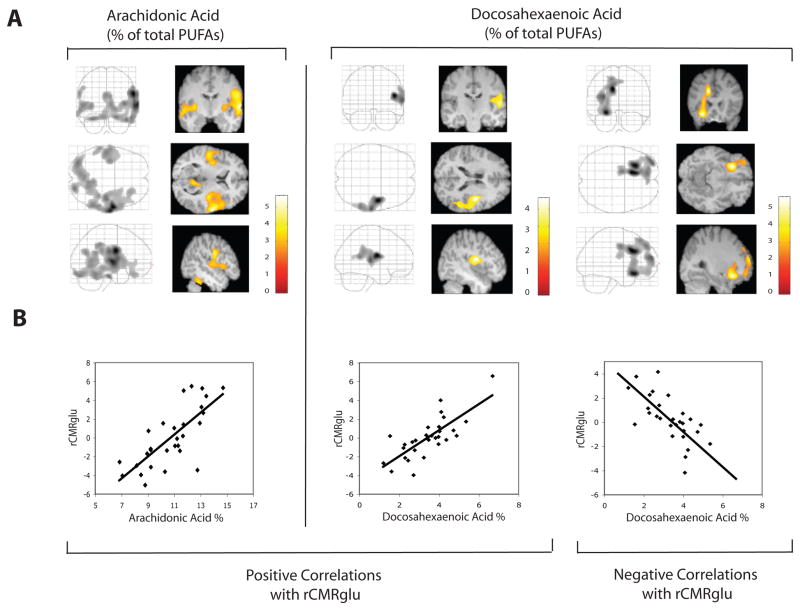
Figure 1. Statistical parametric maps of regional cerebral metabolic rates of glucose metabolism correlated with plasma polyunsaturated fatty acid levels.
Regional cerebral metabolic rates of glucose metabolism (rCMRglu) are shown correlated with plasma phospholipid docosahexaenoate and arachidonate as a percentage (DHA%, EPA%) of total phospholipid polyunsaturated fatty acids (PUFA). All analyses have been corrected for global cerebral rates of glucose metabolism, age, diagnosis (Major Depressive or Bipolar Disorder), and sex. A. Correlations are shown in orthogonal views in a ‘glass brain’ format (left panels) and also as superimposed on relevant MRI slices (right panels). Color scales indicate the strength (t score) of the correlations. B. Correlations are graphed at the cluster global maxima for DHA% (positive, r = 0.77, p = 0.0005; negative, r = −0.77, p < 0.0000) and AA% (positive, r = 0.75, p < 0.0000).

