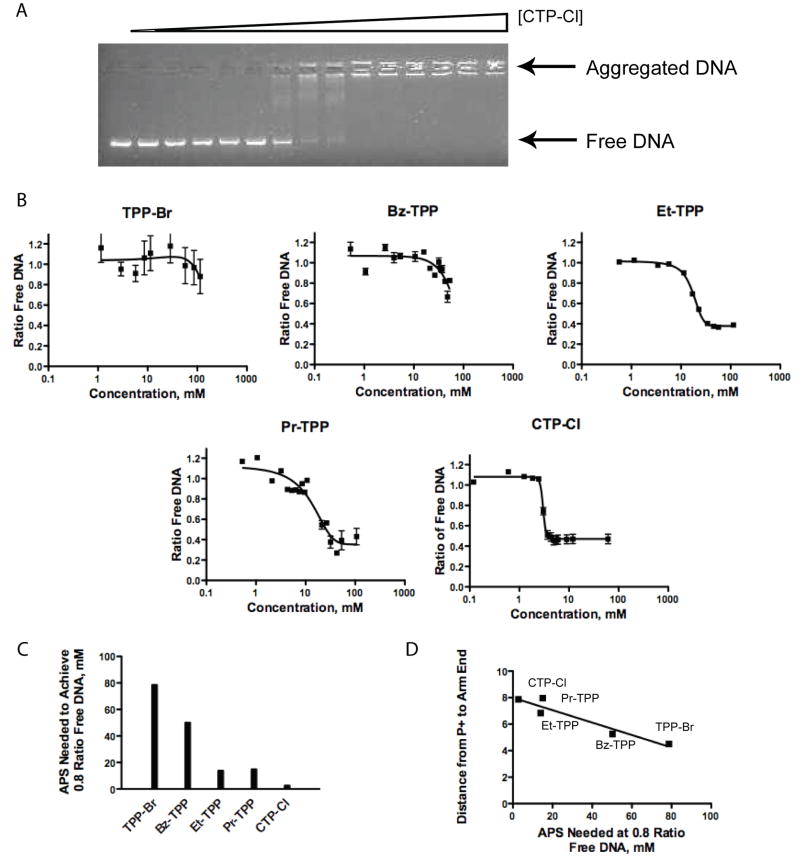
Figure 2.
Evaluation of DNA aggregation capabilities of APS compounds. (A) Representative data of CTP-Cl mediated aggregation of DNA. (B) Plots of the ratio of free DNA versus APS compound concentration. Mean values with error bars indicated were calculated from triplicate experiments. Lanes representing the absence of APS were set at 1.0 ratio free DNA. A background intensity of 0.4 persists. (C) Plot showing APS concentration needed to maintain 0.8 ratio of free DNA. (D) Correlation between APS chemical structures as shown by the angstrom distance of the P+-Y arm and the DNA aggregating ability. Linear trend reported r2 value of 0.9064.

