
Figure 3.
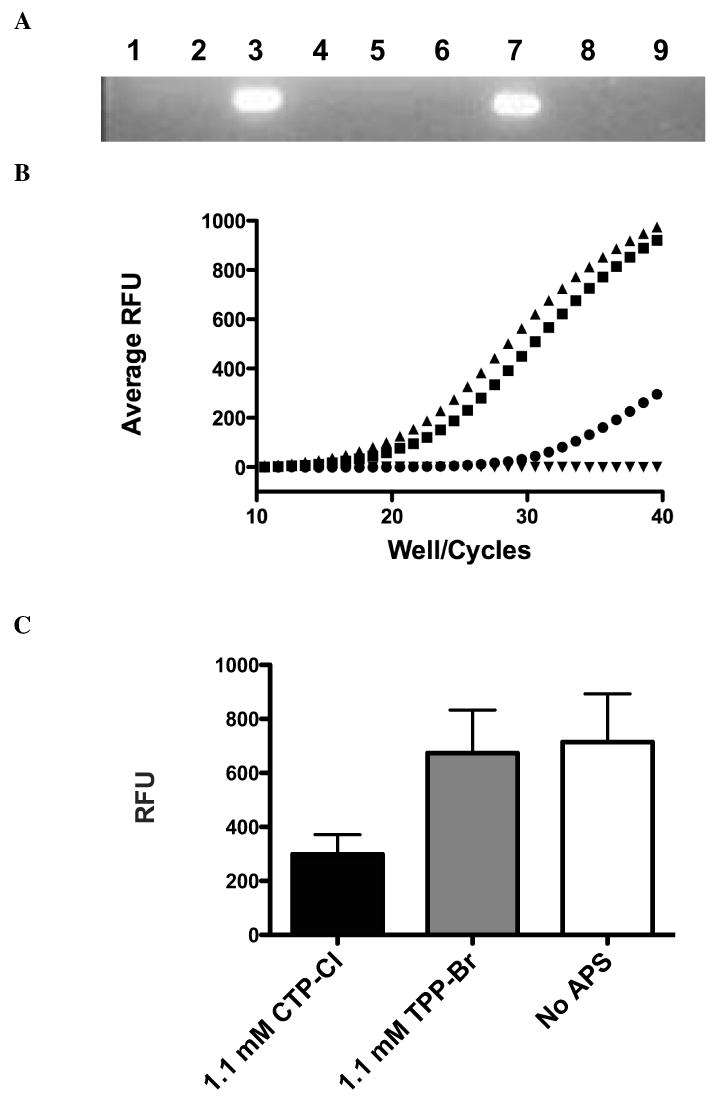
DNA Amplification Block by APS compounds: A) PCR amplification of plasmid DNA in the presence of 176mM CTP-Cl (lane 1), 17.6mM CTP-Cl (lane 2), No APS compounds (lane 3), 17.6mM CTP-Cl pre-incubated with primers (lane 4), no template (lane 5), 107mM TPP-Br (lane 6), No APS (lane 7), 10.7mM TPP-Br pre-incubated with primer (lane 8), 107mM TPP-Br (lane 9). Data presented is representative of three independent trials. B) DNA amplification via qPCR in the presence of 1.1 mM CTP-Cl (circles), 1.1 mM TPP-Br (squares), No APS compound (triangles) and no template (inverted triangles). Independent trials were run in triplicate. Representative sample of three trials is shown. C) Analysis of qPCR amplification endpoints for equimolar doses presented in 3B. The mean values of three independent trials with standard deviations indicated is shown.