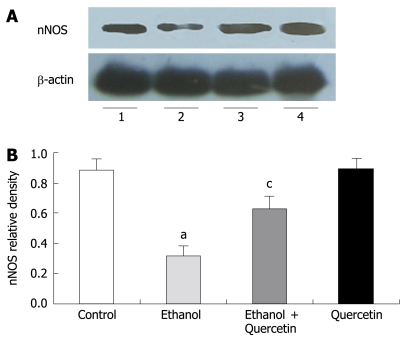
Figure 4.
Immunoblotting of gastric homogenate with the antibody to nNOS in different treatment groups as indicated in lanes 1-4 (A) and values normalized by arbitrarily setting the densitometry of actin (B). The results indicated are in percentage above the control value and are representative of the four independent experiments. aP < 0.05 vs control animals, cP < 0.05 vs ethanol-treated animals.

