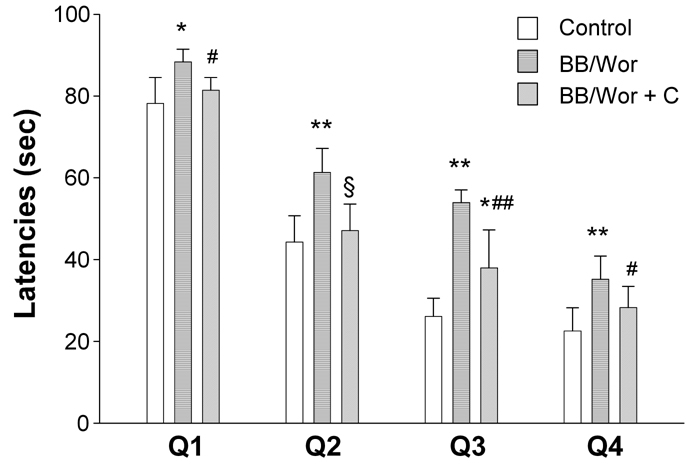
Figure 1. Results of behavioral tests.

The figure shows latencies in seconds for controls, non-treated BB/Wor-rats and C-peptide replaced diabetic BB/Wor-rats in the four quadrants of the Morris water maze. * p < 0.01, ** p < 0.001 vs. control rats. # p < 0.05, ## p < 0.005, § p < 0.001 vs. untreated BB/Wor-rats.
