
Figure 3.
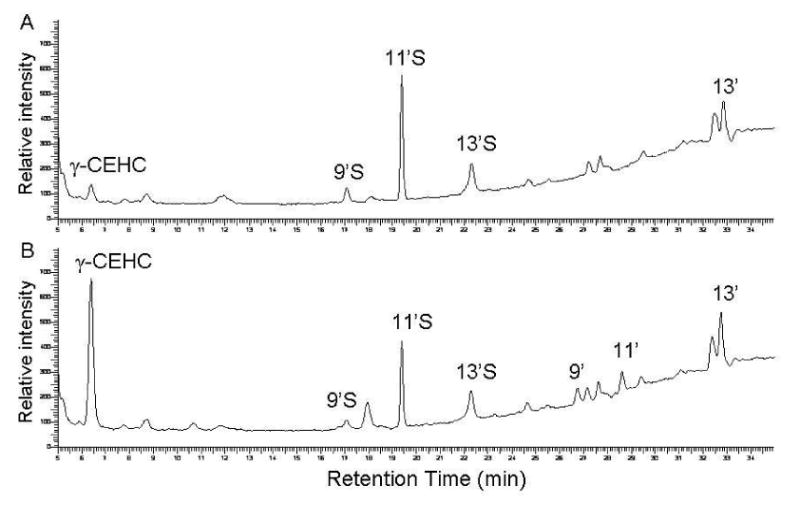
The HPLC-fluorescent chromatograms of the metabolites in the plasma from rats supplemented with γ-TE at 50 mg/Kg before (A) and after sulfatase hydrolysis (B). The plasma sample was extracted by methanol/hexane, incubated with the sulfatase (1.25 mg per sample) for 2 h and extracted by ethylacetate prior to HPLC analysis. The abbreviations of metabolites are the same as specified in Figure 2.