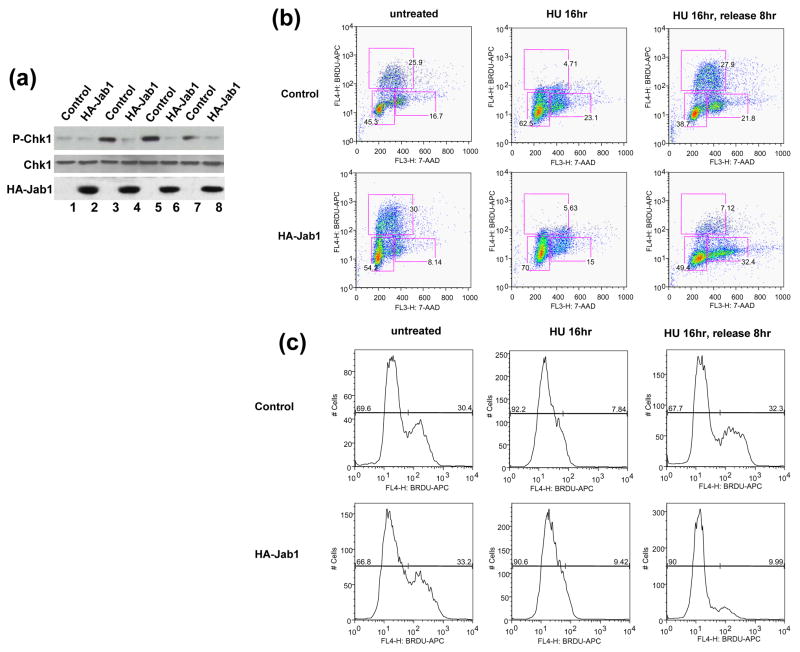
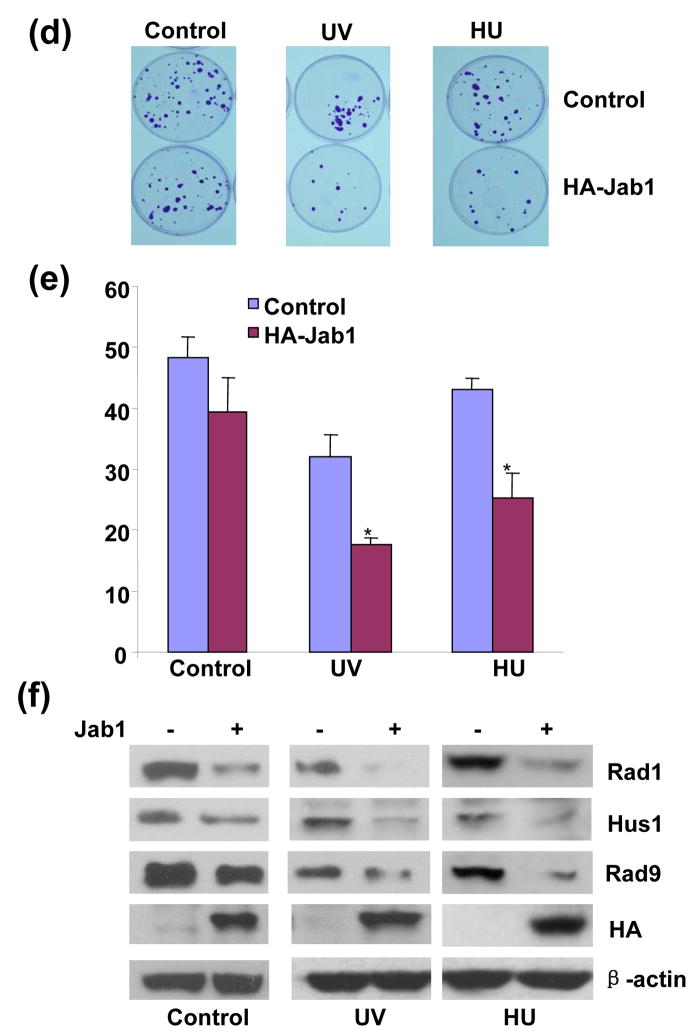
Figure 6. Jab1 suppresses checkpoint signaling activation and disrupts DNA synthesis recovery from blockage.
(a) Jab1 inhibited UV- or HU-induced Chk1 phosphorylation. PANC-1 cells were infected with retroviruses containing empty pSMCVneo vector (Control, lane 1, 3, 5 and 7) or pSMCVneo-HA-Jab1 (HA-Jab1, lane 2, 4, 6 and 8). Cells were then treated with 50J/m2 UV irradiation (lane 3 and 4), 3mM HU for 16hrs (lane 5 and 6) or 20Gy γ-radiation (land 7 and 8). Cell lysates were subjected to Western blot analysis using phosphor-Ser345-specific Chk1 antibody (upper panel), antibody recognizes total Chk1 protein (middle panel) and antibody against HA to recognize ectopically expressed Jab1 (bottom panel). (b) Jab1 inhibited DNA synthesis recovery from replication blockage. PANC-1 cells were infected with retroviruses containing empty pSMCVneo vector (Control) or pSMCVneo-HA-Jab1 (HA-Jab1). Cells were then subjected to 16hr of DNA synthesis block by HU (7.5mM), and released into fresh growth media and pulse labeled with BrdU at indicated time points prior to fixation. After immunostaining with APC-conjugated anti-BrdU antibody and 7-AAD staining, BrdU incorporation and DNA contents were analysed by FACS. Representative data set from three independent experiments is shown. A total of 10,000 events are shown in each sample. (c) Histogram of BrdU-positive cells in (b) showing S-phase recovery and progression of control and Jab1-infected cells after exposure to HU. (d–f) Jab1 suppressed cell viability after UV or HU stimulation. PANC-1 cells infected with retrovirus containing pSMCVneo empty vector (control) or pSMCVneo-HA-Jab1 (HA-Jab1) were treated with 50J/m2 UV irradiation or 3mM HU for 16hrs, and then colony formation was assayed. The colonies were stained with 2% crystal violet (d). (e) is quantitive data of (d). Data points and error bars were derived from three or more independent experiments with duplicate transfections. (f) are the parallel experiments showing expression levels of Rad1, Hus1, Rad9, HA-Jab1 and β-actin of the cells from corresponding experimental groups in (d) by Western blot analysis.


