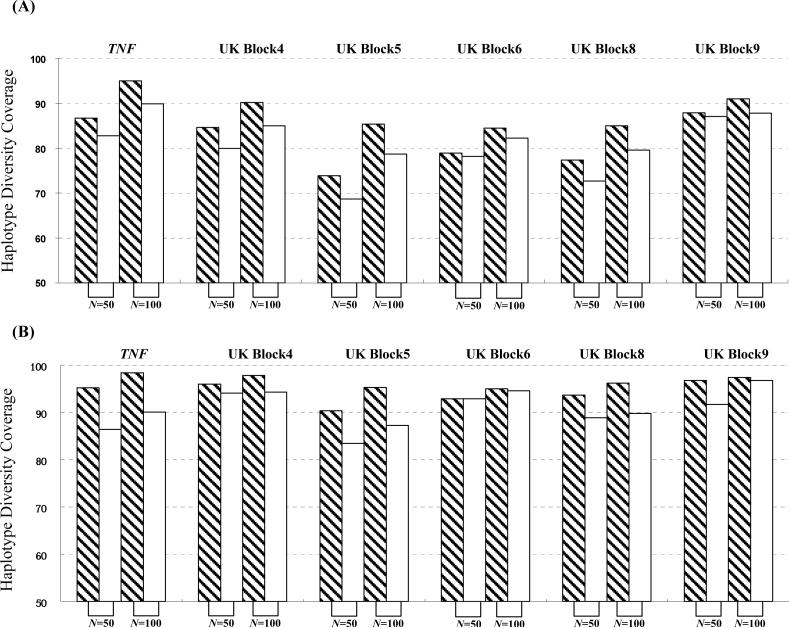
Figure 6.
The impact of the sample size on the efficiency of htSNP selection in the developing panel. We generated our simulated sets based on (1) TNF SNP data in the Gambian sample [Ackerman et al., 2003] and (2) the UK Graves’ disease dataset [Ueda et al., 2003]. In each dataset, we randomly selected 50 (Nd = 25) or 100 (Nd = 50) chromosomes in our developing panel. Based on this developing panel, we applied SMET to choose the minimum htSNP set. Then, we applied the selected htSNP set to two resampling-derived large-scale cohorts comprising 324 chromosomes based on the TNF SNP dataset and 324 chromosomes based on the UK Graves’ disease dataset, respectively. (A) results using E criterion; (B) results using H criterion. The x-axis denotes the size (in terms of the total number of chromosomes) of the developing panel, and y-axis denotes the coverage ratio. Bars denote the developing scheme of the htSNPs: shaded bars, ϕ=100%; open bars, ϕ=90%; 1,000 simulations were conducted for each set of parameters, and in each simulation, haplotypes were randomly sampled without replacement.

