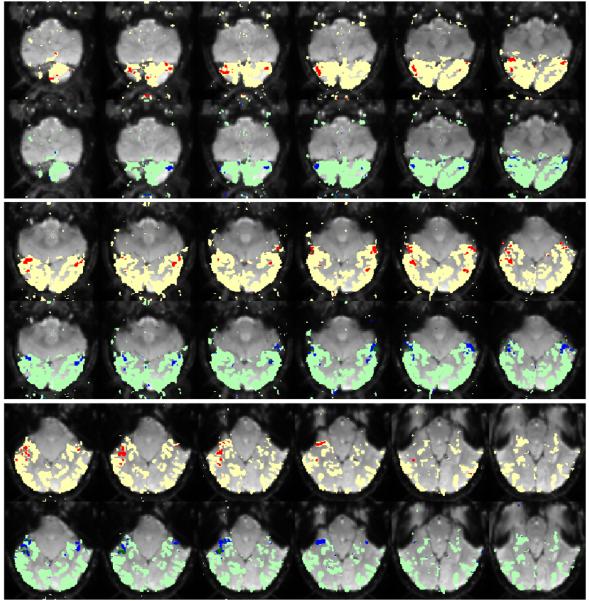
Fig 3.
Spatial maps of the face selective regions found by the statistical test (red) and the mixture model (dark blue). The same slices from the two maps are presented in alternating rows. The mask of visually responsive voxels is shown in different colors (yellow for the hypothesis test, and light green for ours) in the backgound of the two maps to help the visual comparison.

