
Figure 2. Serum cholesterol levels and kidney tumor size in response to atorvastatin therapy in ENU-treated Tsc2+/- mice.
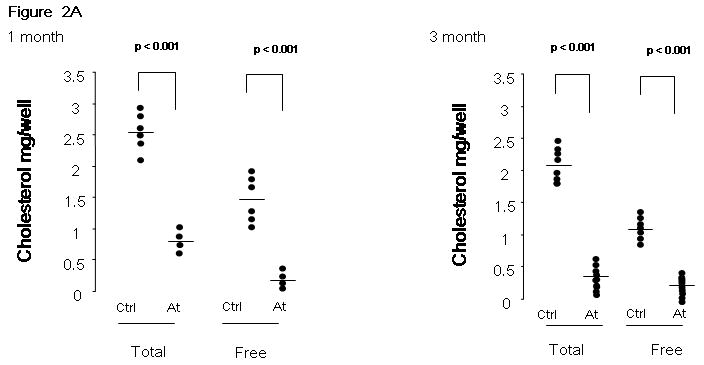
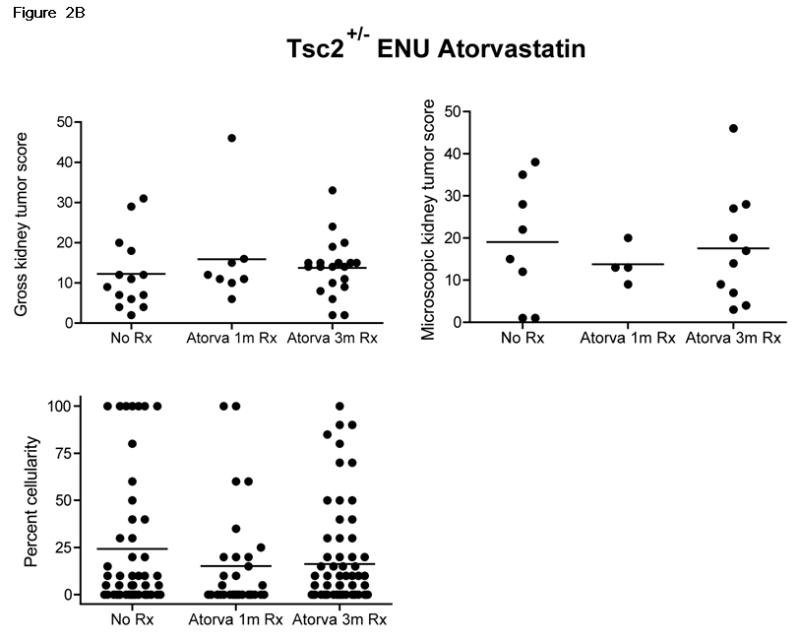
A. Total and free serum cholesterol was measured in atorvastatin treated (At) and control mice (Ctrl), after 1 month or 3 months of therapy. Significance is indicated. B. Gross and microscopic kidney tumor scores and percent cellularity scores from control (No Rx) and atorvastatin (Atorva 1m Rx, Atorva 3m Rx) treated mice are shown. The horizontal bar among the data indicates median.