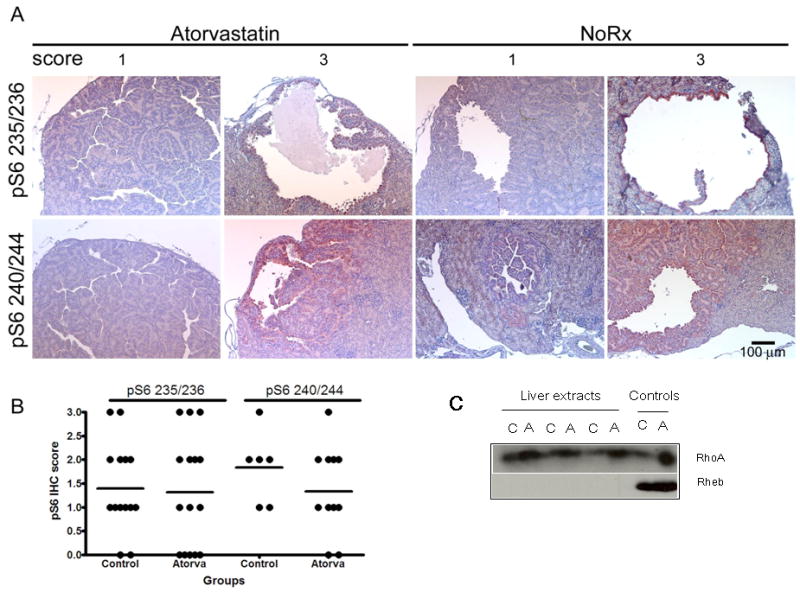
Figure 6. Phospho-S6 immunostaining in kidney tumors and G protein levels in atorvastatin treated and control Tsc2+/- mice.

A. Representative images of phospho-S6 staining (red-brown stain) in control (No Rx) and atorvastatin treated renal cystadenoma; magnification is 20×. Upper panel shows staining for the Ser 235/236 pS6 antibody and lower panel shows staining for the Ser 240/244 pS6 antibody. Note the variable levels (scores 0 thru 3) of staining in both control and atorvastatin treated tumors. B. Comparison of staining intensity for pS6 (pS6 IHC score) in mice treated with atorvastatin for 6 mo (Atorva) and controls. Separate scores for the two pS6 antibodies are shown. C. Immunoblots for RhoA and Rheb resolved on large gels on liver extracts from control (C) and atorvastatin-treated (A) mice. Controls (right) are lysates from ELT3 cells treated with either vehicle (C) or atorvastatin (A). Note that the Rheb signal is not detectable in these liver extracts, while RhoA appears increased in atorvastatin-treated mice, but migration is not changed. Full length blots shown in Figure 6C can be viewed in supplemental Figure 4S.
