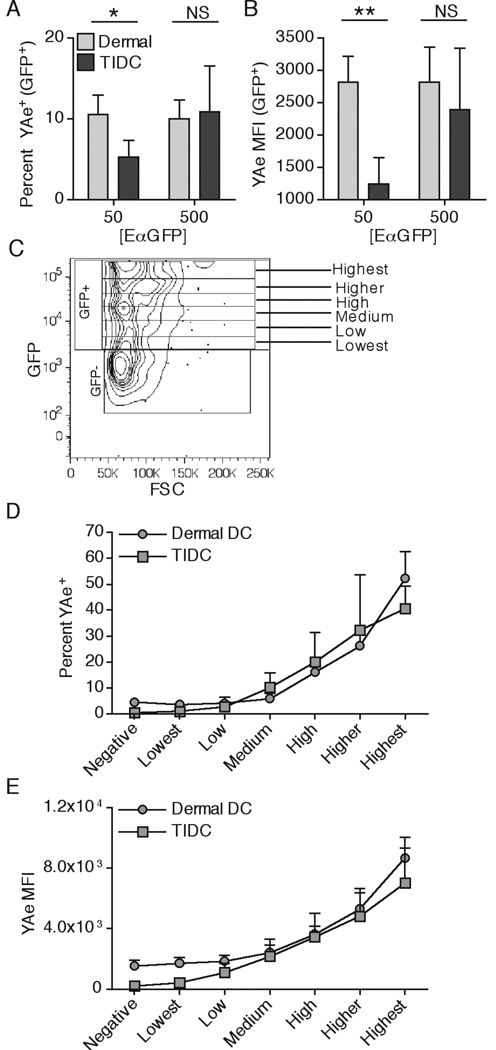
Figure 6.
Dermal DC and TIDC are intrinsically similar in MHC-II presentation. 50µg of EαGFP was injected either s.c. or i.t. Percent YAe+ (A) and YAe MFI of the GFP+ population (B) was quantified in dermal DC and TIDC 3 or 4 hr, respectively, post injection. Gating strategy for separating cells by the level of intracellular GFP is shown (C). Dermal DC and TIDC were examined for the percent YAe+ (D) and YAe MFI after separation into indicated GFP+ populations. Data are representative of at least three independent experiments.

