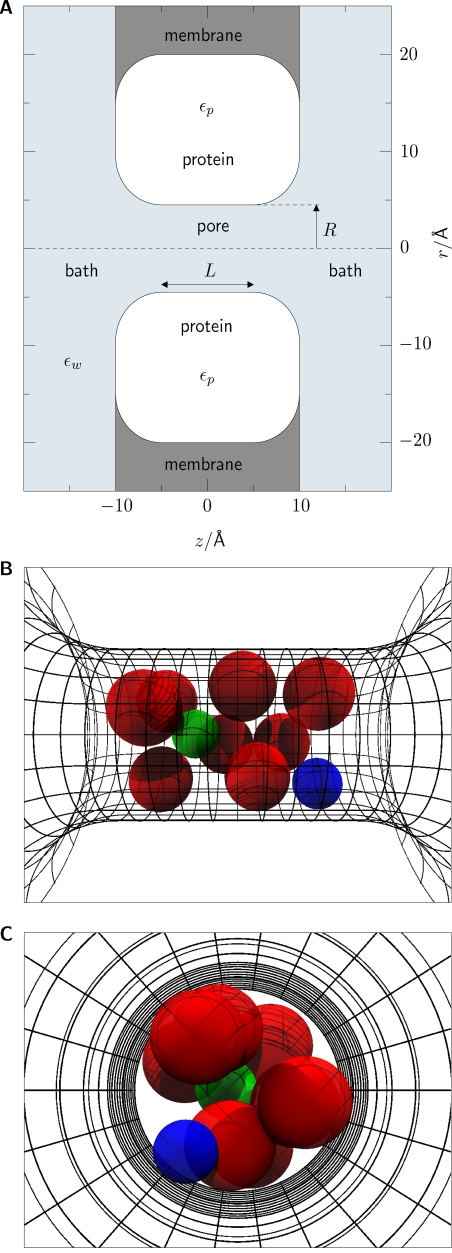
Figure 1.
Geometry of the model. (A) Axial cross section through the central region of the cylindrical simulation cell containing the pore. The selectivity filter is the central pore region (R = 3.5 Å, L = 10 Å) confining the oxygen ions of the EEEE locus. The dielectric coefficients are ϵw = 80 (aqueous regions, light gray) and ϵp = 10 (protein and membrane regions, white and dark gray). (B and C) Spatial views of the surface grid used in discretizing the dielectric interface at the pore wall, and a snapshot of the eight structural oxygen anions (red) and two cations dwelling in the pore (green, Ca2+; blue, Na+). Ions are represented as charged hard spheres with crystal radii (in Å: Ca2+ 0.99; Ba2+ 1.35; Li+ 0.6; Na+ 0.95; K+ 1.33; Cl− 1.81; O1/2− 1.4).

