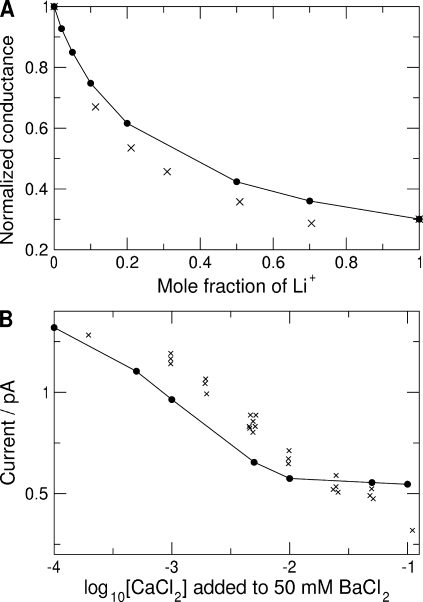
Figure 4.
Competitive conduction of ions of equal charges: comparison to experiment. (A) Varied mole fraction in mixed solutions of LiCl and NaCl (total concentration, 0.16 M). (B) 0.05 M BaCl2 solution with varied amount of added CaCl2. The filled circles and lines represent pore conductances computed from Eq. 3 using simulated axial number densities of the ions. The “×” symbols represent experimental results.

