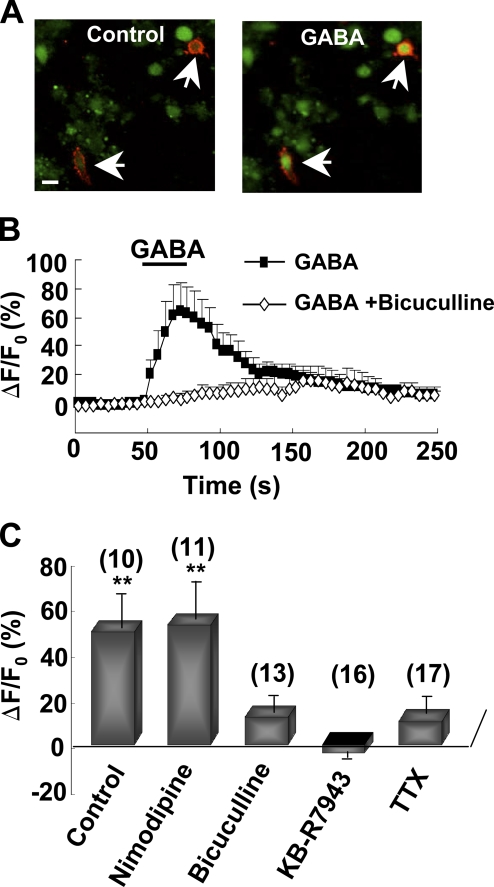
Figure 4.
GABA-induced [Ca2+]i elevation in acutely dissociated NG2 cells. (A) Images of acutely dissociated NG2 cells (arrows) loaded with the Fluo4-AM (green) and identified by live immunostaining with anti-NG2 (red). Images were taken from the same imaging field before (control) and during perfusion with 1 mM GABA. Bar, 10 µm. (B) Time course of [Ca2+]i changes in dissociated NG2 cells perfusion with 1 mM GABA with or without 10 µM bicuculline. (C) Summary of GABA-induced [Ca2+]i changes in dissociated NG2 cells with or without various inhibitors. Data were averaged during 20–50 s after the onset of perfusion with GABA, and normalized by the mean fluorescence intensity obtained during the control period (0–50 s before GABA perfusion) for each cell. **, P < 0.01 compared with ECS group not treated with GABA. Error bars represent mean ± SEM.

