Figure 2.
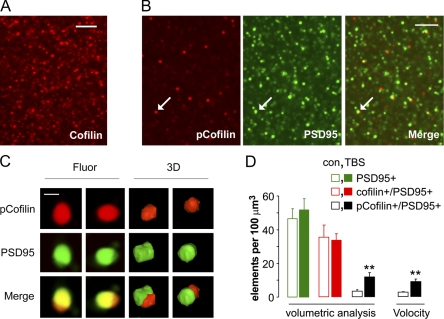
3D reconstruction analysis of immunofluorescence. (A) Deconvolution photomicrograph from proximal CA1 str. radiatum shows total cofilin+ elements. (B) Images show localization of pCofilin+ (left) and PSD95+ (middle) elements in the same field (the arrows indicate overlapping structures). pCofilin+ elements were of similar size and shape as total cofilin+ elements (but less numerous). (C) Photomicrographs (Fluor) and volumetric reconstructions (3D) of a single synapse containing pCofilin ir and PSD95 ir displayed in 30° clockwise turns (left to right). (D) The plot shows numbers of immunolabeled spines (mean ± SEM) in the field of physiological recording for slices receiving control stimulation (con; open bars) or TBS (closed bars). Counts were made from 3D reconstructions. The plot shows separate quantification of total PSD95+, double-labeled cofilin (cofilin+/PSD95+), and double-labeled pCofilin (pCofilin+/PSD95+) elements. The latter comparison was replicated using the Volocity measurement module. PSD95+ elements associated with pCofilin ir represented <5% of the total PSD95+ puncta in control slices. Slices receiving TBS showed approximately threefold more pCofilin+/PSD95+ colabeled elements versus controls (**, P < 0.01). Bars: (A and B) 5 µm; (C) 0.5 µm.

