Figure 1.
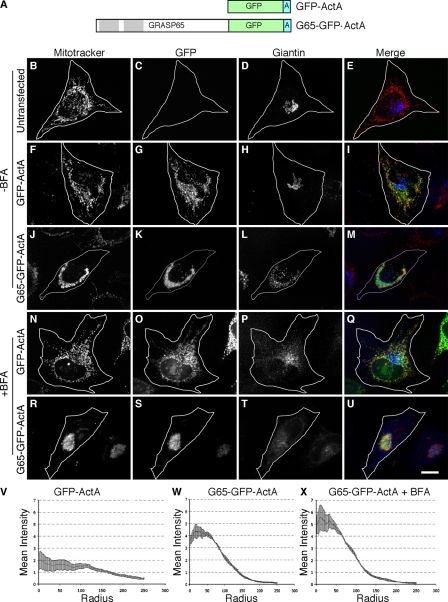
Mitochondrial clustering by GRASP65. Schematic diagram of the constructs (A). Untransfected HeLa cells (B–E) or cells expressing GFP-ActA (F–I) or G65-GFP-ActA (J–M) were analyzed 24 h after transfection using Mitotracker (red) to stain mitochondria, GFP fluorescence (green) to localize the transfected proteins, and giantin (blue) staining to image the Golgi apparatus. An identical analysis was performed after a 30-min BFA treatment on cells expressing GFP-ActA (N–Q) or G65-GFP-ActA (R–U). Bar, 10 µm. Radial profile plots show the spread of mitochondrial fluorescence starting from the centroid and extending to the cell periphery for cells expressing GFP-ActA (V), G65-GFP-ActA (W), or BFA-treated cells expressing G65-GFP-ActA (X). Values are averages corresponding to the fraction of total fluorescence present in each concentric circle drawn from the centroid (n = 3, ±SEM, >15 cells/experiment).

