Figure 4.
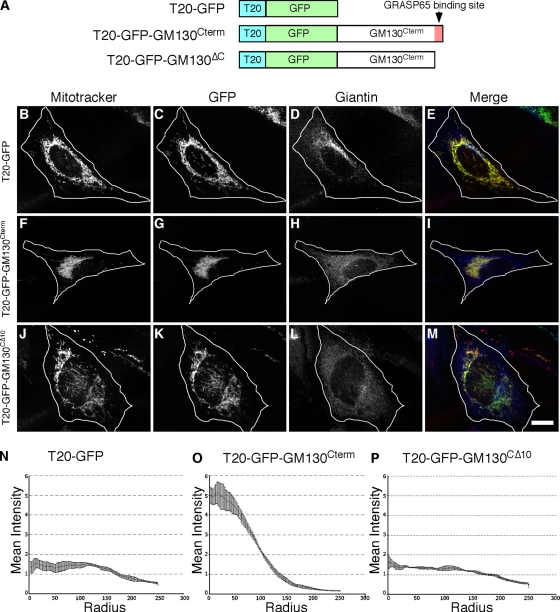
Clustering by the GRASP65-binding domain of GM130. Schematic diagram of the constructs (A). 24 h after transfection, HeLa cells expressing T20-GFP (B–E), T20-GFP-GM130Cterm (F–I), or T20-GFP-GM130CΔ10 (J–M) were BFA treated for 30 min and analyzed using Mitotracker (red), GFP fluorescence (green), and giantin staining (blue). Bar, 10 µm. Radial profile plots (n = 3, ±SEM, >15 cells/experiment) of T20-GFP (N), T20-GFP-GM130Cterm (O), or T20-GFP-GM130CΔ10 (P).

