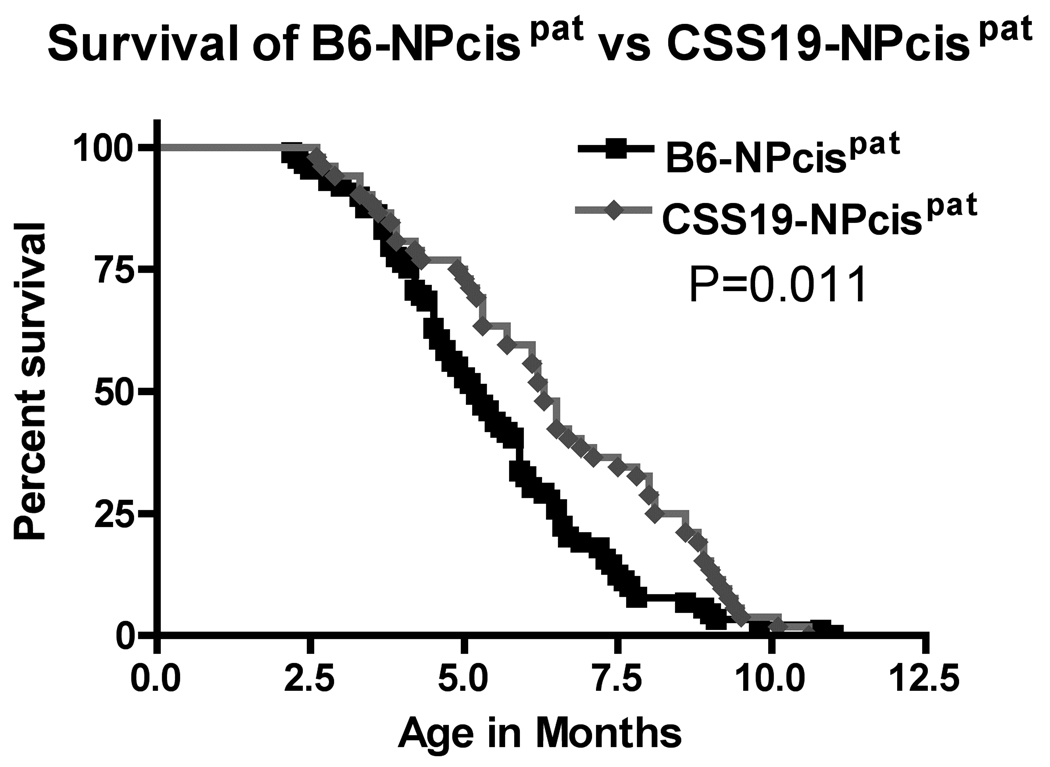
FIGURE 2.
Overall Kaplan-Meier survival curves for CSS19-NPcis pat and B6-NPcis pat progeny. The age at which mice were euthanized due to tumors or poor health (as described in Materials and Methods) is plotted as percent survival. The Kaplan-Meier curve compares the paternal NPcis progeny of the CSS19 strain (grey diamond) to B6 strain (black square). The P value for the logrank test comparing the two curves is shown.

