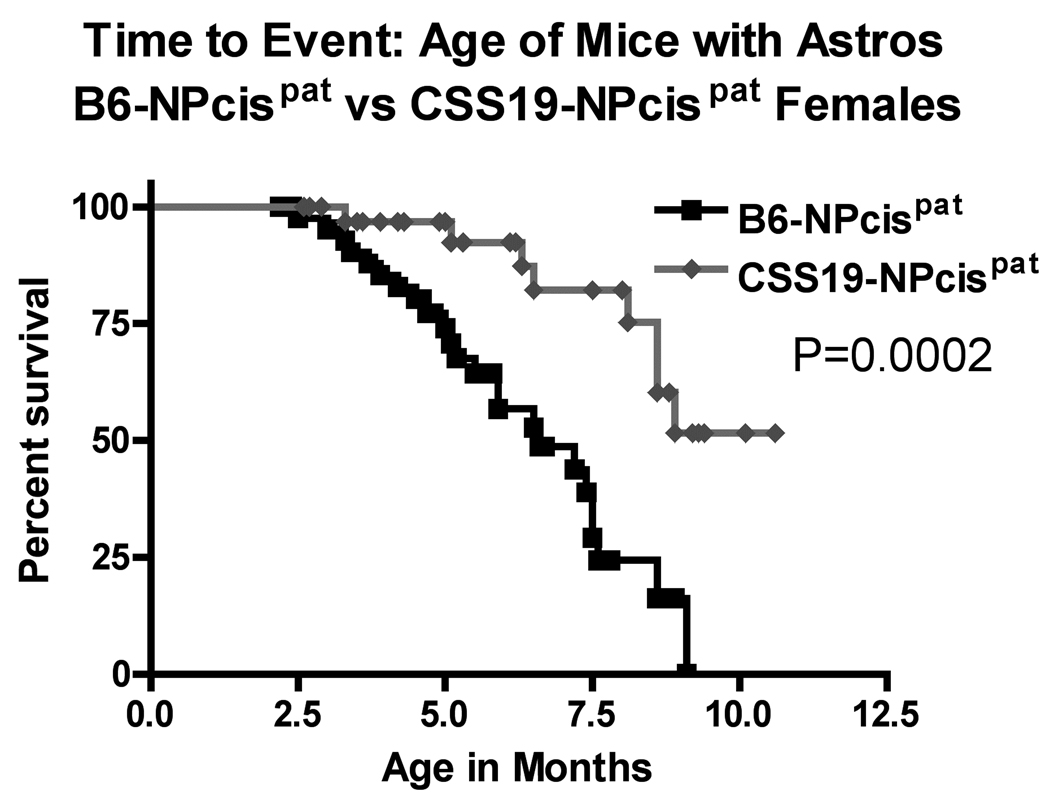
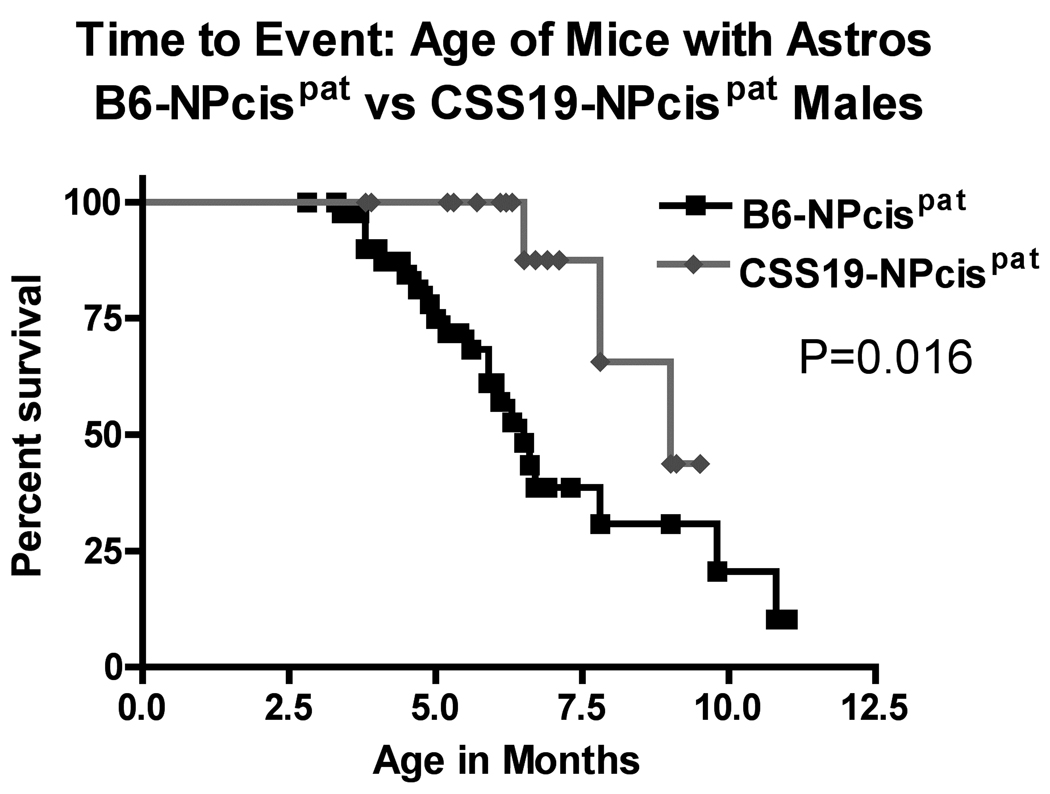
FIGURE 4.
Kaplan-Meier survival curves of the age at death of CSS19-NPcis pat and B6-NPcis pat progeny with astrocytomas. The age at which affected mice were euthanized is plotted as percent survival. The top panel compares the female CSS19-NPcis pat progeny (grey diamond) to B6-NPcis pat progeny (black square), while the bottom panel shows the results for the male progeny. P values (log rank test) for each sex, are displayed, respectively, in each panel.


