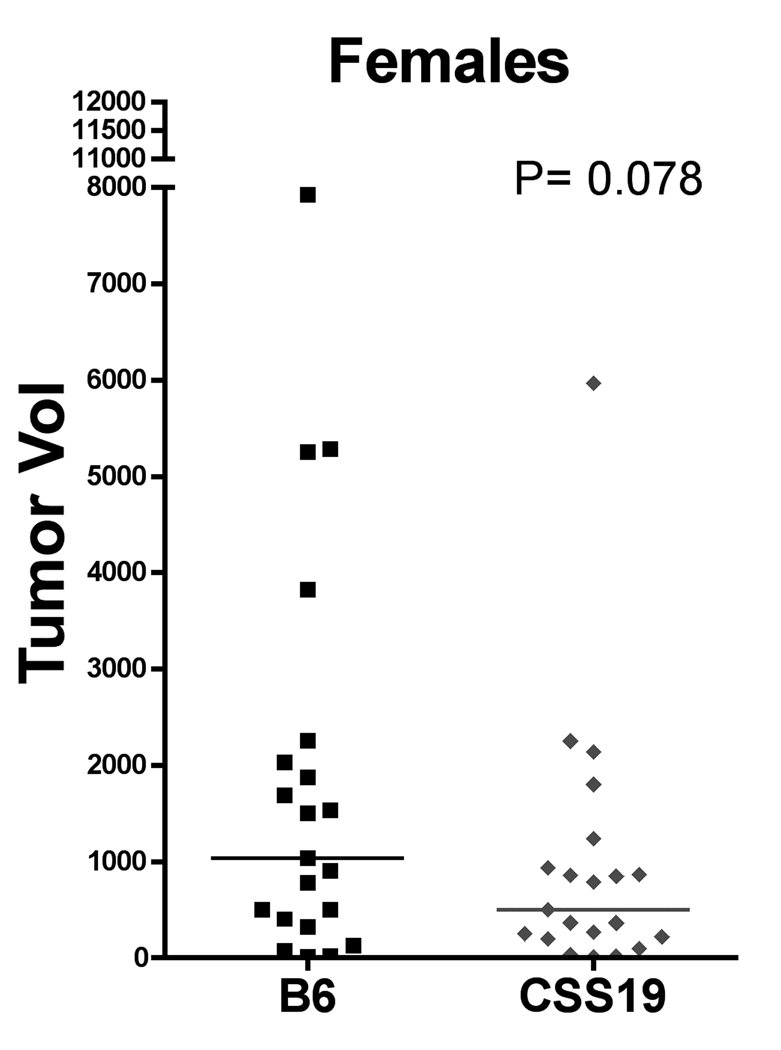
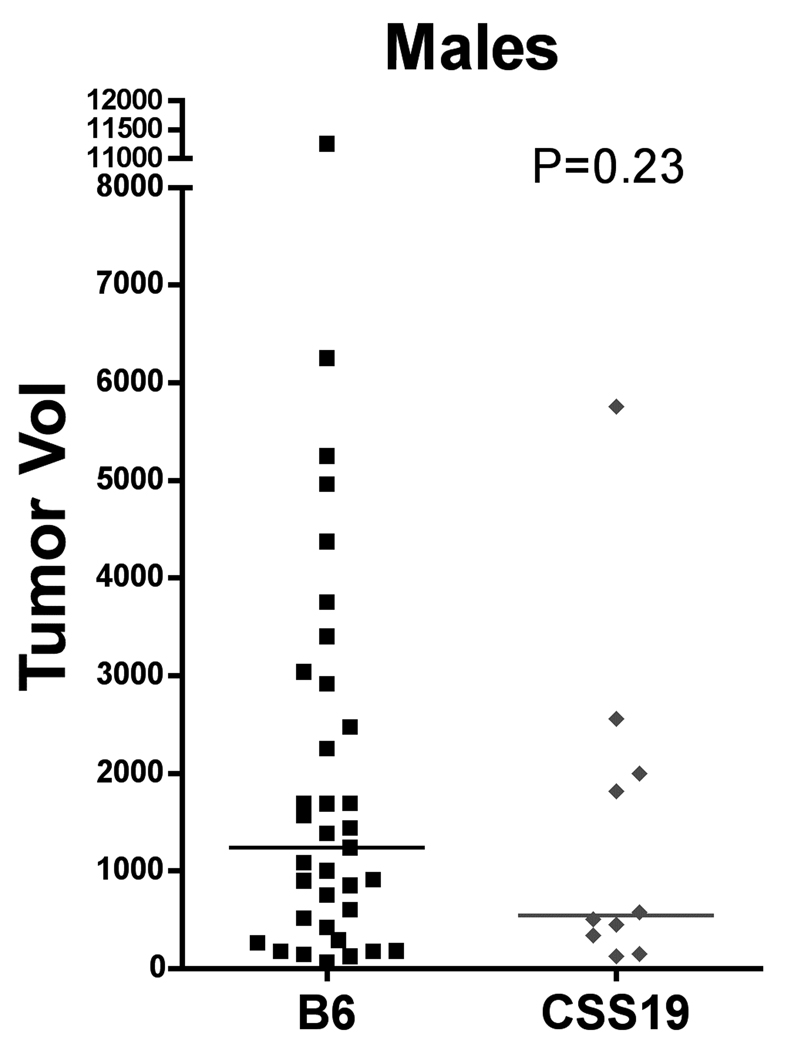
FIGURE 5.
Size of PNSTs in CSS19-NPcis pat and B6-NPcis pat progeny. Tumors were measured after mice were euthanized (as described in Materials and Methods). Tumor size was approximated as an ellipsoid. Within each cohort, each tumor is plotted individually, with the calculated mean size indicated by a line. The left panel compares the tumor volume in CSS19-NPcis pat (CSS19; grey diamond) females to B6-NPcis pat (B6; black square) females. The right panel shows tumor size for males. The P value for the Wilcoxon rank sum test is shown for each graph.


