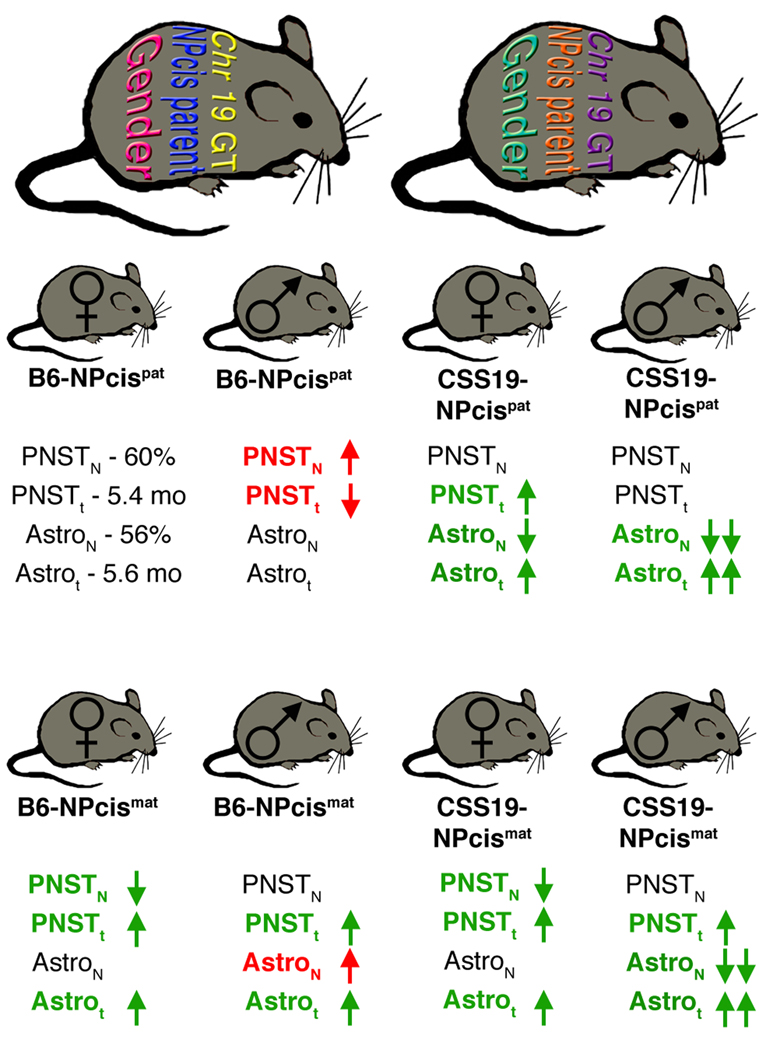
FIGURE 6.
Model for the interaction of sex, parentage, and genetic background on tumor susceptibility. Different factors contributing to tumor susceptibility can differ in their state like bars in a barcode. For illustrative purposes in panel A, sex can have two states (magenta or cyan), the inheritance of the NPcis chromosome from the mother or father can have two states (blue or orange) and the genotype on chromosome 19 can have multiple different states (shown as yellow or purple). These states combine together to determine the susceptibility of the individual animal to different tumor types (panel B). The susceptibility of mice to PNSTs and astrocytomas is shown in panel B using B6-NPcis pat females as a reference, where mice develop PNST with penetrance (PNSTN) of 60% and an average age (PNSTt) of 5.4 months, and develop astrocytomas with penetrance (AstroN) of 56% and an average age (Astrot) of 5.6 months. Mice varying by sex, NPcis inheritance, and chromosome 19 genotype are depicted as having increased or decreased penetrance and average age of tumors, relative to the B6-NPcis pat females (upper left). Changes associated with an increased susceptibility are indicated in red text, whereas changes associated with increased resistance are indicated in green text. It is clear that tumor penetrance and age are differentially affected by sex, parentage, and chromosome 19 genotype.

