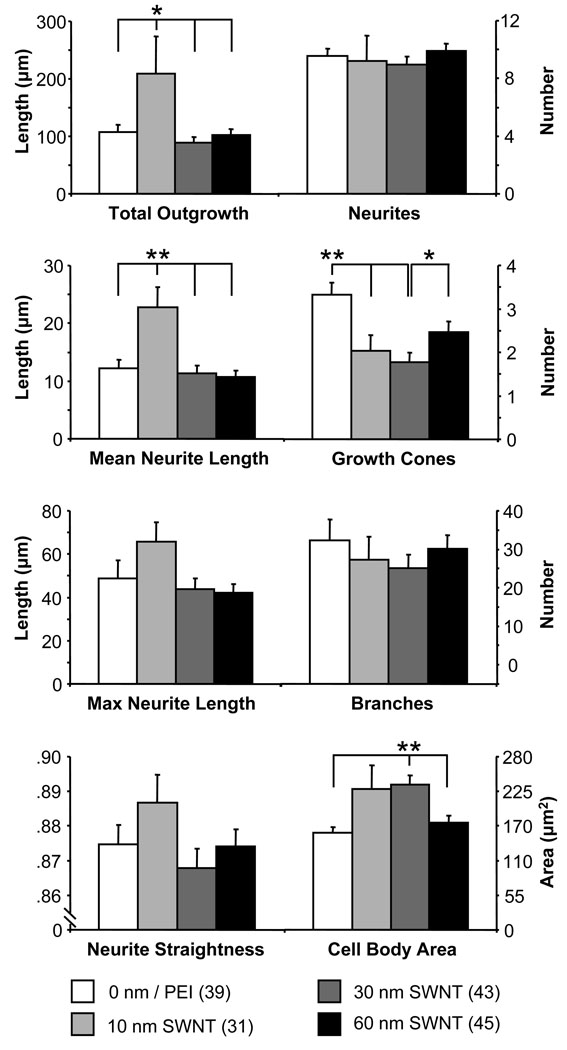
Figure 4.
Parameters of cell growth and morphology for neurons grown on SWNT substrates of varying conductivity. Bars represent means ± standard errors of means. Numbers in parenthesis indicate the number of neurons studied in each condition. Asterisks indicate a significant difference in measurements (one-way ANOVA followed by Fisher’s LSD test; *p < 0.05,** p < 0.01).

