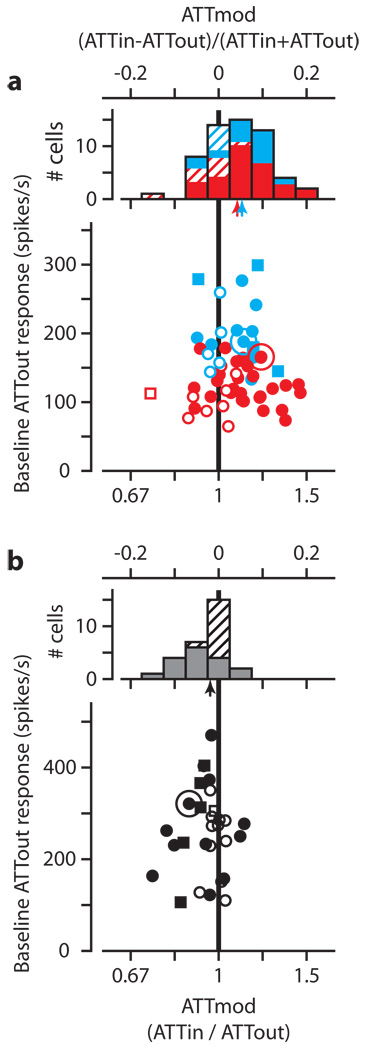
Figure 2.
Effect of attention on LGN and TRN. a, Scatterplot showing mean baseline ATTout response versus attentional modulation (ATTmod) for 19 LGNm neurons (blue) and 38 LGNp neurons (red). Solid symbols are significant response changes (Wilcoxon rank-sum test, p<0.01). Squares denote experiments in which performance did not guarantee attention (see full Methods section). Distributions of ATTmod appear above the scatterplots. Hatched areas of each bar denote changes that did not reach significance. Arrows show median ATTmod for LGNm (blue) and LGNp (red). b, Similar scatterplot and histogram for TRN. In all plots, the larger circles indicate the Figure 1 example neurons.

