
Fig. 2.
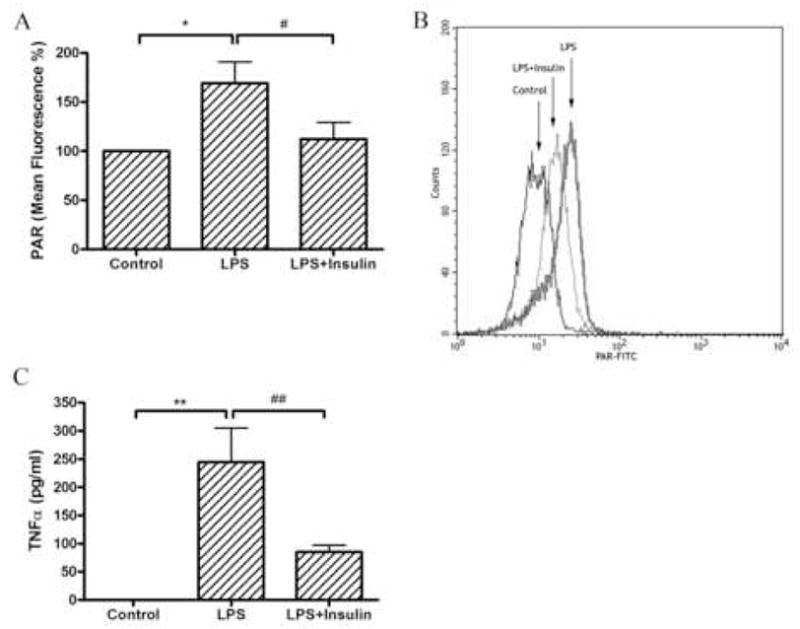
Panel A.Differences in PAR content of circulating lymphocytes in response to lipopolysaccharide and insulin treatment. Mean fluorescence intensity of R1 cells (lymphocytes) stained with anti-PAR antibody. Endotoxin caused a significant increase of the PAR content of these cells, which was attenuated by insulin treatment. Values are mean ± SEM *: p≤0.05 vs. Control, #: p≤0.05 Insulin+LPS vs. LPS alone. Panel B. Representative flow cytometric measurement. PAR-FITC shows the amount of fluorescence labeling in the cells. Panel C. Serum TNF-α levels at 180 min after LPS injection with or without insulin treatment. Endotoxin caused a marked increase in serum TNF-α levels, which was abolished by insulin treatment. Values are mean ± SEM. **: p≤0.01 vs. Control, ##: p≤0.01 Insulin+LPS vs. LPS alone. N=4–6 determinations per experimental group.