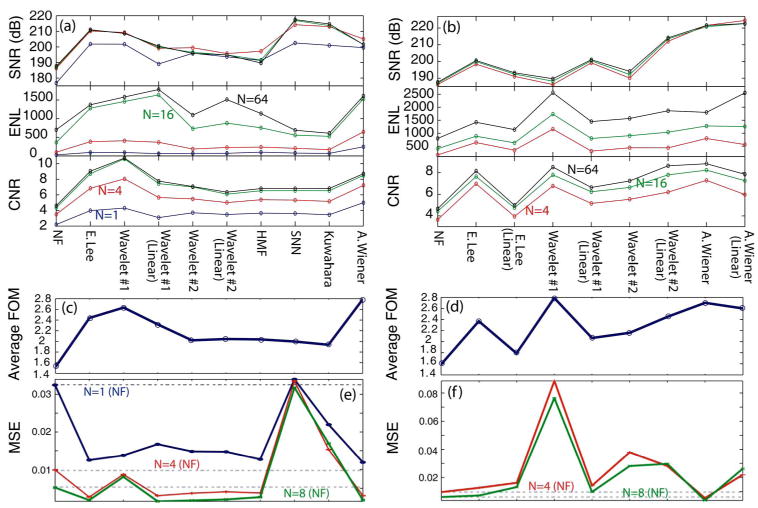
Fig. 1.

(Color online) Performance summary of various speckle-reduction filters applied to a bovine retina OFDI image. (a) and (b) show SNR, ENL, and CNR computed for each case. The results of (a) have been obtained by filtering the final image after angle compounding (postcompounding), whereas the results of (b) have been obtained by filtering each individual angle before forming the final angle compound image (precompounding). (c) and (d) show the average FOM for (a) and (b), respectively. (e) and (f) show the MSE of each filter, as defined in Eq. (2). N, number of angles; NF, no filtering; CNR, contrast-to-ratio; SNR, signal-to-noise ratio; ENL, equivalent number of looks; FOM, figure of merit; MSE, mean-square error; “(Linear),” filter applied to linear image as opposed to the logarithmic image. Only promising linear filter results are shown.
