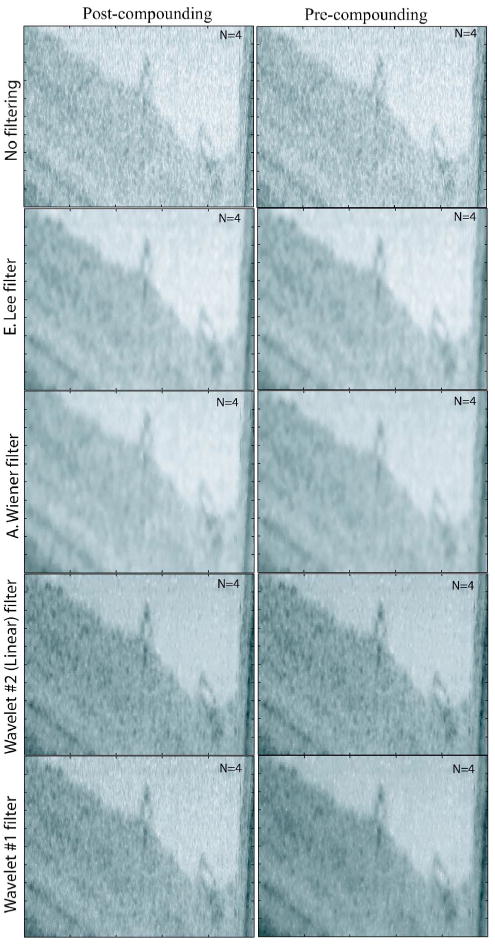
Fig. 6.

(Color online) Comparison of the performance of precompounding versus postcompounding. In this comparison N=4 is used. Each image has 250 A lines, where the distance between two adjacent A lines is ∼5 μm. One hundred pixels are shown for each A line covering a depth of 0.67 mm in air.
