Figure 8.
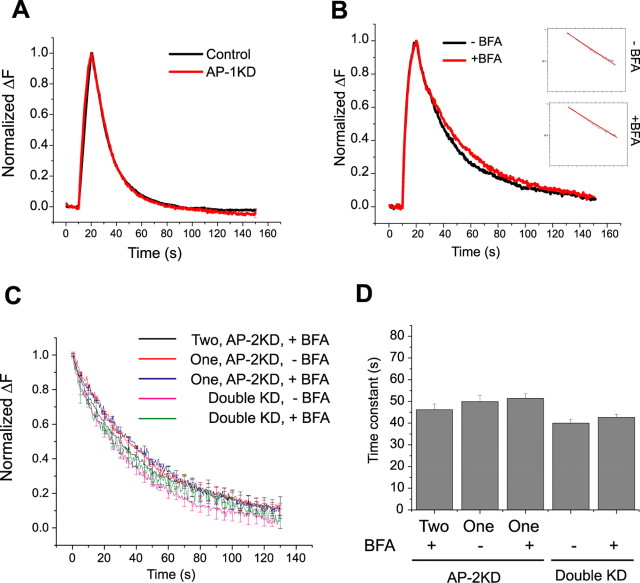
Brefeldin-A sensitivity and complex kinetics in the absence of AP-2 arise from compensation by AP-1. A, Representative ensemble average of endocytosis from control (black) and AP-1KD (red) neurons. Neurons were stimulated at 10 Hz (100 action potentials). The average time constant for vG–pH fluorescence decay in control (τcontrol = 15.6 ± 1.2 s) and AP-1KD neurons (τAP-1KD = 16.4 ± 1.3 s; n = 7) are not significantly different. B, Representative vG–pH trace of endocytosis in the presence or in the absence of BFA in double (AP-1/AP-2) KD neurons. Semilog plot of poststimulus endocytosis are shown in the inset (inset: top, −BFA; bottom, +BFA). Time constant of endocytosis obtained from individual cell ensemble average in the presence or in the absence of BFA (n = 5) in double KD neurons has minor sensitivity to BFA (τBefore = 38.2 ± 4.3 s; τAfter = 43.9 ± 5.1 s). C, D, Representative ensemble average vG–pH fluorescence recovery traces (C) and average time constant (D) of endocytosis from single bouton analysis from BFA treated or untreated AP-2KD and double (AP-1/AP-2) KD neurons. The data for AP-2KD were sorted into the average value of the time constant in BFA for boutons that showed either two (Two) or a single (One) exponential component before BFA application. This analysis shows that these conditions all have similar average endocytosis kinetics (AP-2KD; τtwo BFA+ = 46.2 ± 2.5 s, τone BFA− = 49.9 ± 2.8 s, τone BFA+ = 51.4 ± 2.2 s: Double KD; τBFA− = 40.0 ± 1.7 s, τ BFA+ = 42.7 ± 1.5 s.). For each category, the average was derived from between 108 and 131 boutons from four to seven different cells.

