
Figure 2.
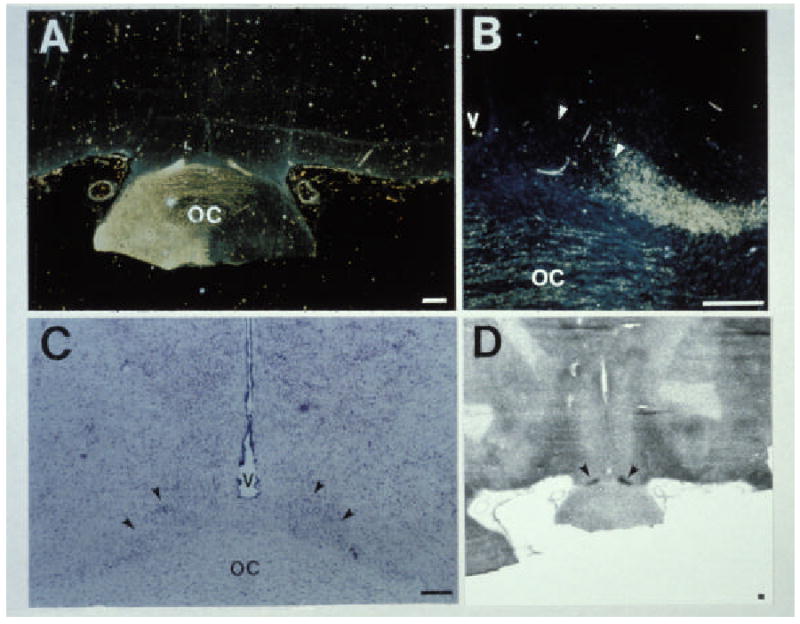
Innervation of the SCN by the retinohypothalamic tract (RHT) in a newborn baboon infant. A. Low-power image showing labeling of retinal fibers in the optic chiasm by horseradish peroxidase. B. Adjacent tissue section showing the location of the SCN. C. High power image showing projections of the RHT into the right SCN. D. Autoradiographic image generated from [14C]2-deoxyglocose uptake studies showing that light exposure at night induces increases in SCN metabolic activity. Areas of increased uptake are dark. Arrows identify the SCN. Scale bar = 5 mm. Reproduced by permission from ref 16.