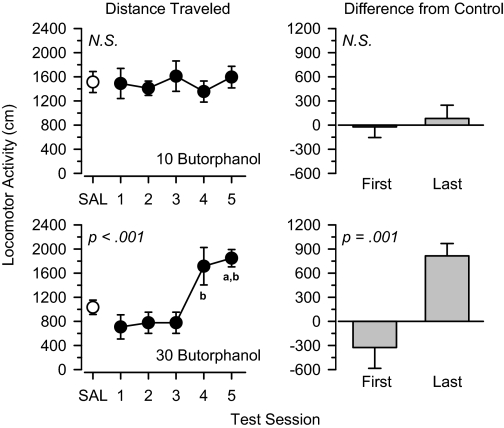
Fig. 7.
Locomotor effects of 10 mg/kg butorphanol (top) and 30 mg/kg butorphanol (bottom) over 5 days of treatment. Left, locomotor activity expressed as distance traveled (centimeters) after saline administration (SAL) and 5 days of drug treatment. Right, locomotor activity on days 1 and 5 expressed as difference from saline control values (centimeters). Significant differences are indicated as follows: a, significantly different from saline (p < 0.05); and b, significantly different from day 1 (p < 0.05).

