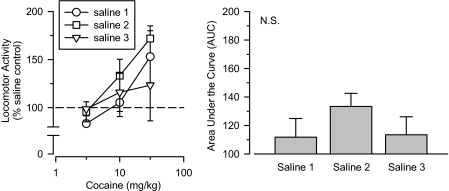
Fig. 1.
Effects of cumulative doses of cocaine in three groups of rats treated with saline and tested approximately 18 months apart (saline 1, saline 2, saline 3). Left, locomotor activity expressed as a percentage of saline control values. Right, AUC estimates for each group. Vertical lines, S.E.; where not indicated, the S.E. fell within the data point.

