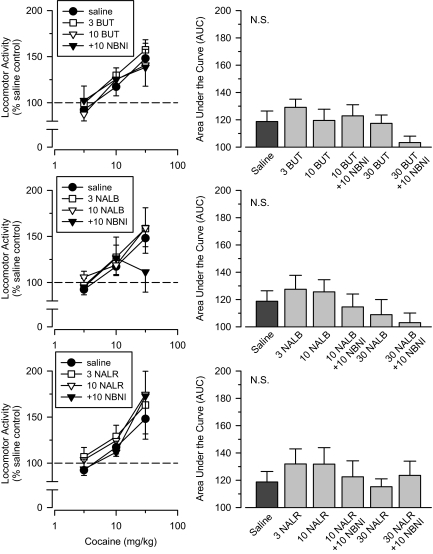
Fig. 8.
Top, effects of cumulative doses of cocaine in separate groups of rats treated with saline (saline), 3.0 mg/kg butorphanol (3.0 BUT), 10 mg/kg butorphanol (10 BUT), 10 mg/kg butorphanol + 10 mg/kg nor-binaltorphimine (10 BUT + 10 NBNI), 30 mg/kg butorphanol (30 BUT; right only), and 30 mg/kg butorphanol + 10 mg/kg nor-binaltorphimine (30 BUT + 10 NBNI; right only). Middle, effects of cumulative doses of cocaine in separate groups of rats treated with saline (saline), 3.0 mg/kg nalbuphine (3.0 NALB), 10 mg/kg nalbuphine (10 NALB), 10 mg/kg nalbuphine + 10 mg/kg nor-binaltorphimine (10 NALB + 10 NBNI), 30 mg/kg nalbuphine (30 NALB; right only), and 30 mg/kg nalbuphine + 10 mg/kg nor-binaltorphimine (30 NALB + 10 NBNI; right only). Bottom, effects of cumulative doses of cocaine in separate groups of rats treated with saline (saline), 3.0 mg/kg nalorphine (3.0 NALR), 10 mg/kg nalorphine (10 NALR), 10 mg/kg nalorphine + 10 mg/kg nor-binaltorphimine (10 NALR + 10 NBNI), 30 mg/kg nalorphine (30 NALR; right only), and 30 mg/kg nalorphine + 10 mg/kg nor-binaltorphimine (30 NALR + 10 NBNI; right only). Left, locomotor activity expressed as a percentage of saline control values. Right, AUC estimates for each group. Vertical lines, S.E.; where not indicated, the S.E. fell within the data point.

