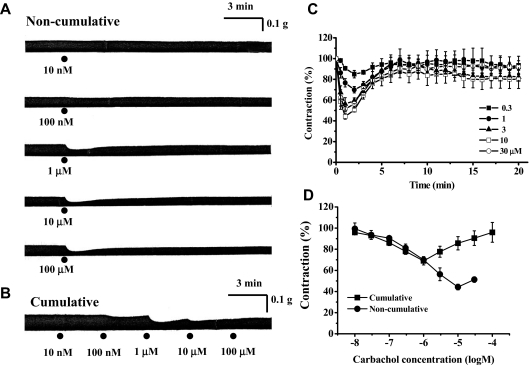
Fig. 2.
Effects of carbachol on EFS-induced contractions of left atria from wild-type (DDY) mice. A, typical traces of inotropic responses to 10 nM, 100 nM, 1 μM, 10 μM, and 100 μM carbachol applied noncumulatively. B, typical traces of inotropic response to carbachol applied cumulatively at 3-min intervals (10 nM, 100 nM, 1 μM, 10 μM, and 100 μM). C, time course of inotropic responses to carbachol (300 nM, 1 μM, 3 μM, 10 μM, and 30 μM). Ordinate, relative amplitude of EFS-induced contraction expressed as a percentage of the amplitude just before application of carbachol. Abscissa, incubation time with carbachol. D, comparison of concentration response curves for carbachol constructed from cumulative (▪) and noncumulative application of carbachol (•). Ordinate, relative amplitude of EFS-induced contraction expressed as a percentage of the amplitude just before application of carbachol. Abscissa, concentration of carbachol (log M). Values are means and S.E.M. of five to six experiments.

