
Figure 4. P. gingivalis genes differentially expressed following CSE exposure.
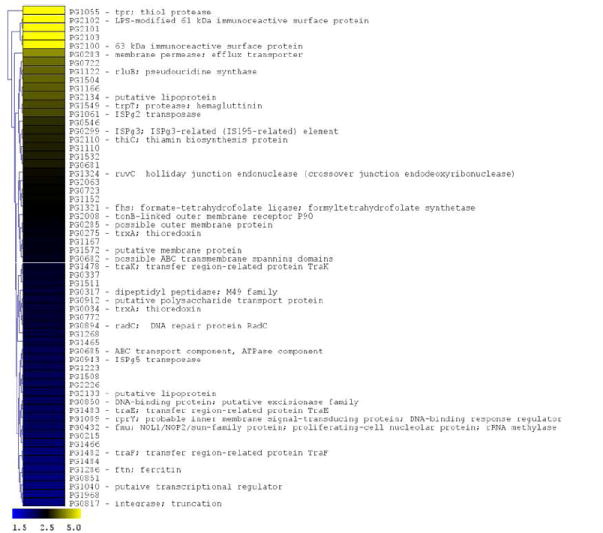
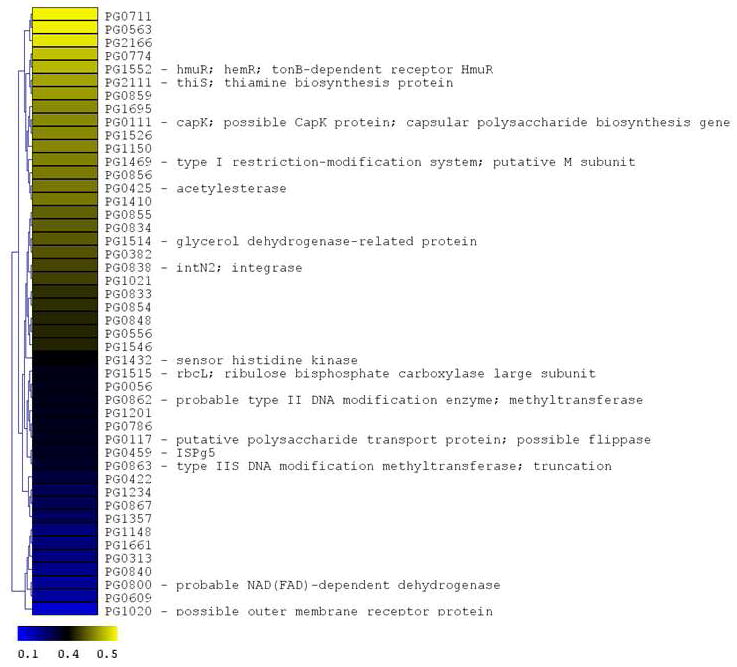
The microarray data of Log2 ratios were uploaded onto MultipleExperiment viewer 4.1v (January 8, 2008 release) software and evaluated by t-test with p value based on ‘t’ distribution with significance (alpha cut-off) set at p <0.01. The subset of significant genes were divided into two groups based on i) upregulated genes (>1.5 fold increase) and ii) down regulated genes (<0.5 fold). The distance was calculated based on Euclidean distance with average linkage and the tree was generated based on hierarchical clustering. CSE-induced genes are shown in Figure 4a (significantly induced genes >1.5 fold compared to baseline; p < 0.01; genes are represented in yellow to blue colour with the lower limit = 1.5; midpoint value = 2.5; and upper limit = 5). CSE-suppressed genes are shown in Figure 4b (significantly down-regulated genes < 0.5 fold compared to baseline; p < 0.01; genes are represented in yellow to blue colour with the lower limit = 0.1; midpoint value = 0.4; and upper limit = 0.5).