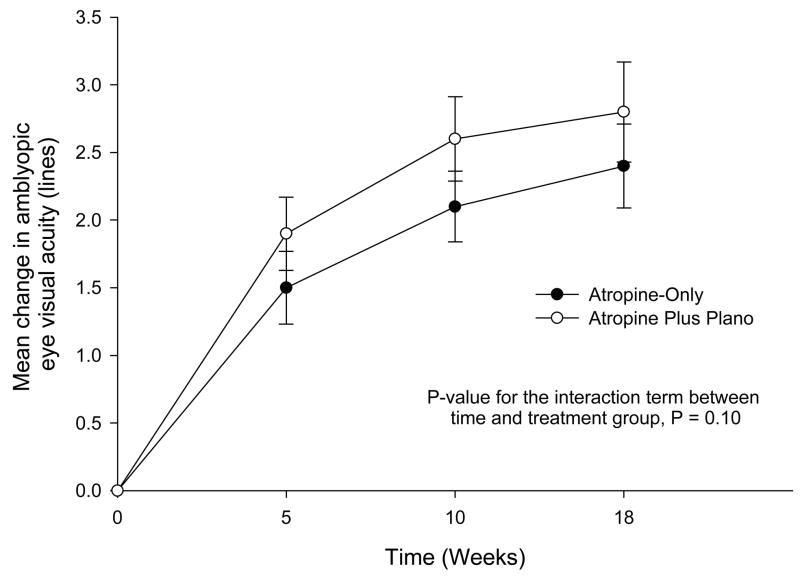
Figure 2. Rate of Improvement in Amblyopic Eye Visual Acuity.
Amblyopic eye visual acuity in each group at baseline, 5 weeks, 10 weeks, and 18 weeks. The point estimates and 95% confidence intervals for the mean change from baseline are shown. A log transformation for time (plus 0.5) was used to form a linear relationship between visual acuity and time. SD = standard deviation; logMAR = logarithm of the minimum angle of resolution; A = Atropine-only group; A + P = Atropine plus plano lens group.
| 20/160 | 1%† | |||||||
| 20/125 | 2%* | 1%* | 1%* | |||||
| 20/100 | 8% | 17% | 2% | 1% | 2% | 2% | 1% | |
| 20/80 | 16% | 17% | 4% | 4% | 2% | 2% | 2% | 5% |
| 20/63 | 32% | 31% | 12% | 11% | 6% | 8% | 5% | 7% |
| 20/50 | 27% | 19% | 27% | 15% | 17% | 7% | 7% | 8% |
| 20/40 | 18% | 17% | 20% | 24% | 24% | 19% | 21% | 10% |
| 20/32 | 21% | 33% | 27% | 31% | 33% | 27% | ||
| 20/25 | 11% | 11% | 13% | 21% | 15% | 22% | ||
| 20/20 | 4% | 9% | 9% | 13% | 14% | |||
| 20/16 | 1% | 5% | ||||||
| Mean logMAR | 0.47 | 0.50 | 0.32 | 0.31 | 0.26 | 0.24 | 0.23 | 0.22 |
| (SD) | 0.12 | 0.13 | 0.16 | 0.15 | 0.15 | 0.16 | 0.16 | 0.20 |
| Mean Lines | -- | -- | 1.5 | 1.9 | 2.1 | 2.6 | 2.4 | 2.8 |
| Change | ||||||||
| (SD) | 1.3 | 1.3 | 1.2 | 1.5 | 1.4 | 1.8 | ||
| Treatment Group | A | A + P | A | A + P | A | A + P | A | A + P |
| Visit | Baseline | 5 Weeks | 10 Weeks | 18 Weeks | ||||

