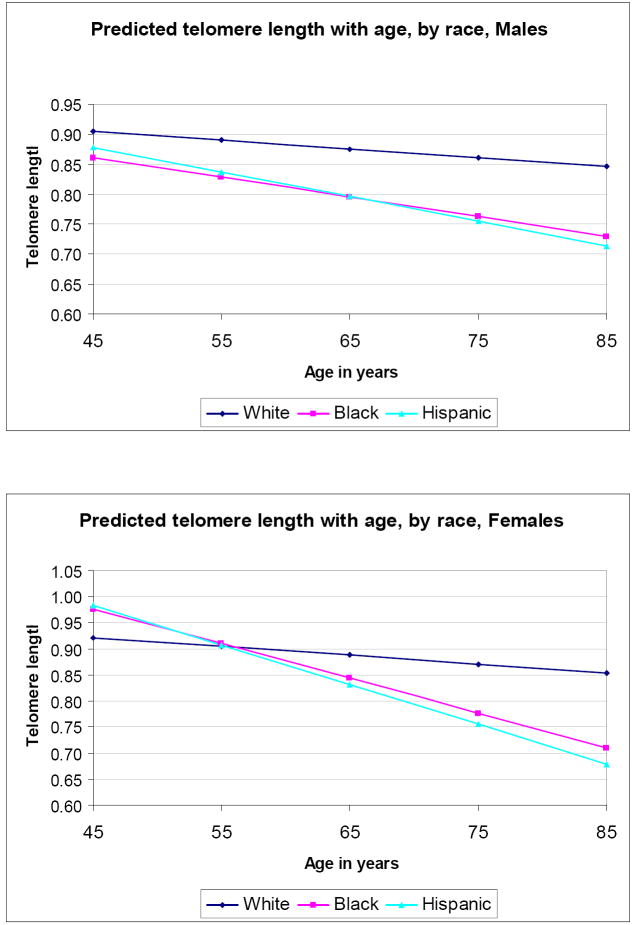
Figure 1. Predicted telomere length by age, sex, and race/ethnicity*.
*Predictions based on sex-stratified full models shown in Table 3. All predictions are at the mean levels of risk factors. In men, P values for differences in slopes (compared to whites) are 0.5 for Blacks and 0.3 for Hispanics; in women they are 0.03 for Blacks and 0.01 for Hispanics.

