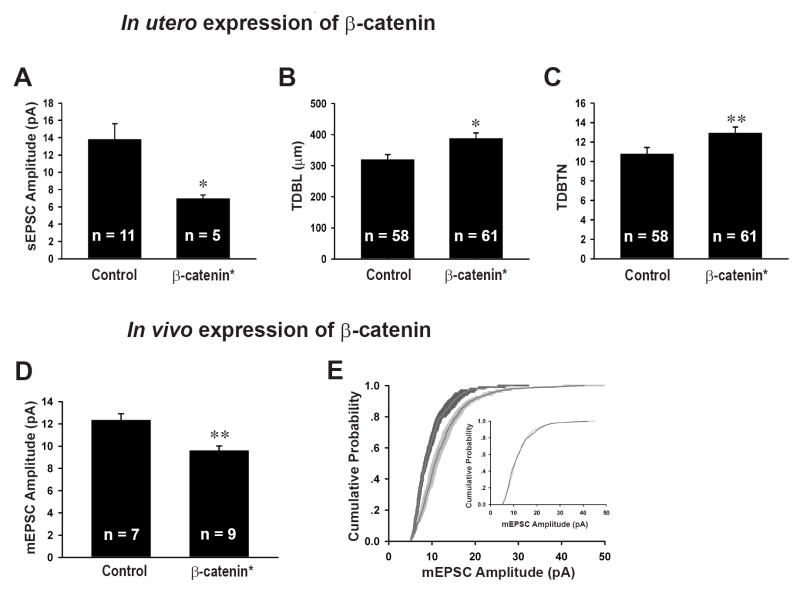
Figure 4. The effects of acute in vivo β-catenin* expression on mEPSC amplitudes and dendritic morphology in hippocampal slices.
(A) Average sEPSC amplitudes of neurons in utero electroporated with β-catenin* (6.94 ± 0.41 pA, p < 0.05) compared to non-electroporated neighbors (control, 13.80 ± 1.83 pA). (B) TDBL of neurons electroporated with YFP alone (319.89 ± 15.98 μm) or β-catenin* and YFP (387.59 ± 18.02μm, p = 0.01). (C) TDBTN of neurons electroporated with YFP alone (10.78 ± 0.65) or β-catenin* and YFP (12.93 ± 0.61, p < 0.005). (D) Average mEPSC amplitudes of neurons infected with a virus expressing β-catenin* (9.60 ± 0.43 pA, p < 0.01) compared to uninfected neighbors (control, 12.33 ± 0.57pA). (E) Cumulative distributions of mEPSC amplitudes of neurons infected with β-catenin* (dark gray) plotted against uninfected neighbors (light gray), p < 0.005; inset, scaled β-cat* mEPSC distribution transformed according to best fit: β-cat* = control × 0.6461 + 1.7239, r2 = 0.99, p = 0.89. *p < 0.05, **p < 0.01; error bars represent SEM.

