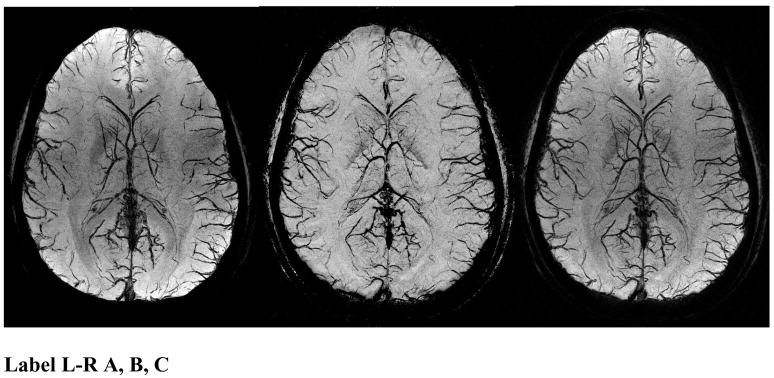
Figure 1.
SWI data at 4T showing an mIP over 26mm of the magnitude (A, left), phase (B, center), and SW (C, right) images. The SW images combine the contrast of the magnitude and phase images. Note the magnitude and the SW processed data both have spatial inhomogeneities from rf penetration effects while the phase image (b) is remarkably uniform.

