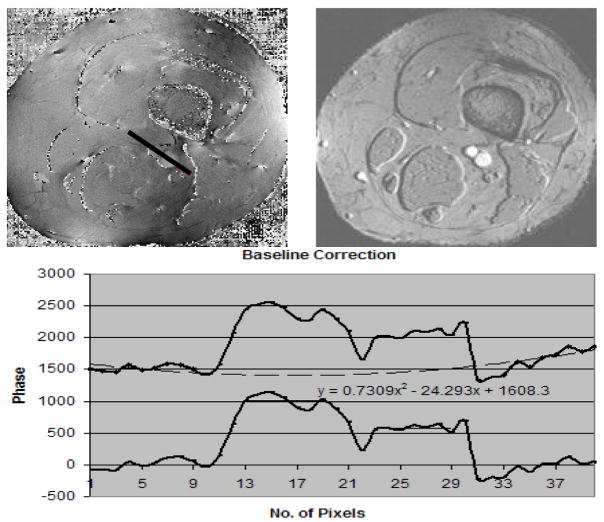
Figure 10.
(A, the top left image) is the associated phase image to B (the top right image) which represents the magnitude image from a TE = 25ms scan The fitted line shows the profile through the phase of the background, artery and vein. The phase values along the profile (black line starting from bottom right moving to top left of the line) in the A runs through the background tissue, artery and vein which are measured. The phase values from the background are then fitted to a parabola and subtracted from the phases along the profile (black line) to create a background corrected phase of the artery (larger vessel) and vein (smaller vessel).

