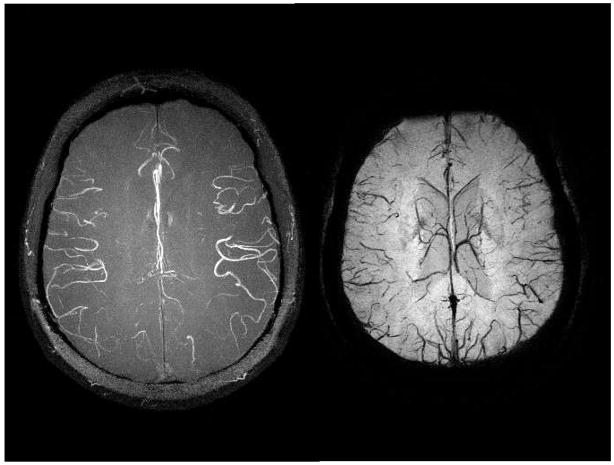
Figure 4.
Both the MRA maximum intensity projection (A, left) and the minimum intensity projection over SWI processed data (B, right) are acquired from a single echo SWI data set with 0.5mm isotropic resolution. The data were acquired at 4T with: TR = 26ms, TE = 15ms, FA = 11°, and 80 partitions. These high resolution scans depict the usual M4 arteries with excellent edge definition. Again, the venous anatomy is seen to be quite different than the arterial pattern. The 4T image shows the capability of higher fields to produce better MRAV images.

