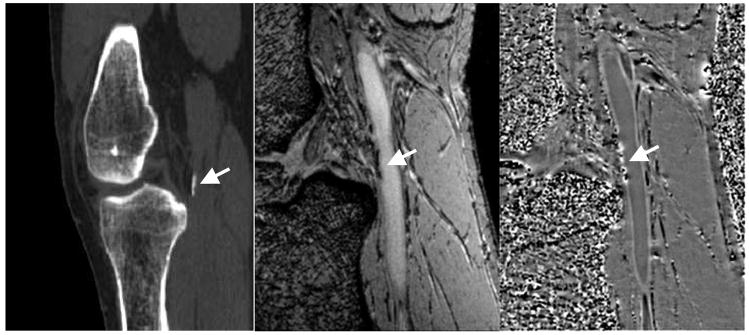
Figure 8.
CT scan (A,left) showing calcification at the edge of the popliteal artery just behind the knee. Magnitude gradient echo image (B, center) showing the signal loss from the calcification in the same area. SWI filtered phase image (C, right) showing the diamagnetic effect from the calcification. Note the similar shape and extent of the calcification in both the CT and MR results.

