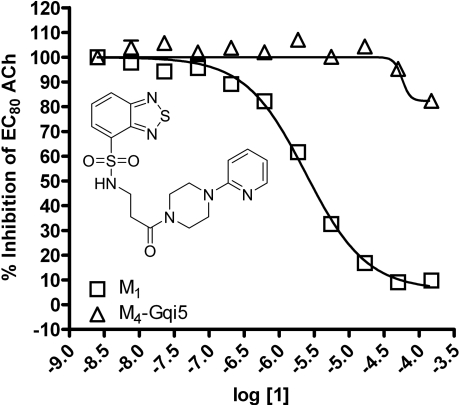
Fig. 1.
HTS lead 1 displays M1 versus M4 mAChR selective antagonism. Inset, structure of compound 1. CRCs of compound 1 were performed in the presence of an EC80 concentration of ACh for each receptor in a calcium mobilization assay. Data were normalized to the maximum response to 10 μM ACh and are presented as the percentage of the EC80 ACh response. The IC50 for compound 1 inhibition of an EC80 ACh response is 2.4 ± 1.2 μM for M1. The M4 mAChR calculated IC50 is greater than 150 μM. All data points represent the mean of three independent experiments performed in triplicate, and error bars represent S.E.M.

