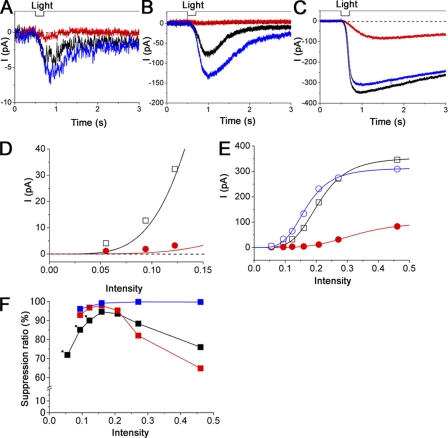
Figure 12.
[cAMP]i dependence of the odorant suppression. (A) Current suppression by odorant at low light intensity (0.06). After the control (black), light-induced current response was obtained under the odorant stimulation (0.02% cineole, red). Blue, current recovery. Vh = −50 mV. Cineole was applied 0.5 s before the light stimulation and continued for 3 s. (B) Current suppression by odorant at medium light intensity (0.16). (C) Current suppression by odorant at high light intensity (0.46). A–C were obtained from the same cell. (D) Dose–response relation at low intensities. Data were obtained from A and additional data that are not presented. Open black squares, the control; filled red circles, suppressed currents. Plots were fitted by the Hill equation with nH of 4.5 and 4.4. (E) Intensity dependence of the dose–response relation. Open black squares, the control; filled red circles, suppressed current; open blue circles, the recovery. Plots were fitted by the Hill equation with nH of 4.5, 4.4, and 4.2, respectively. (F) Relation between intensity and suppression ratio. Black, red, cineole; blue, dihydromyrcenol. Asterisks show data obtained from D.

